About the project
The widget was created to promote environmental awareness and encourage sustainable living. With its help, event participants can calculate the amount of carbon dioxide (CO2) they might produce by considering their use of devices, electricity, water, etc.
Event organizers can easily generate and customize their own widget, obtain the code, and embed it into their event platform.
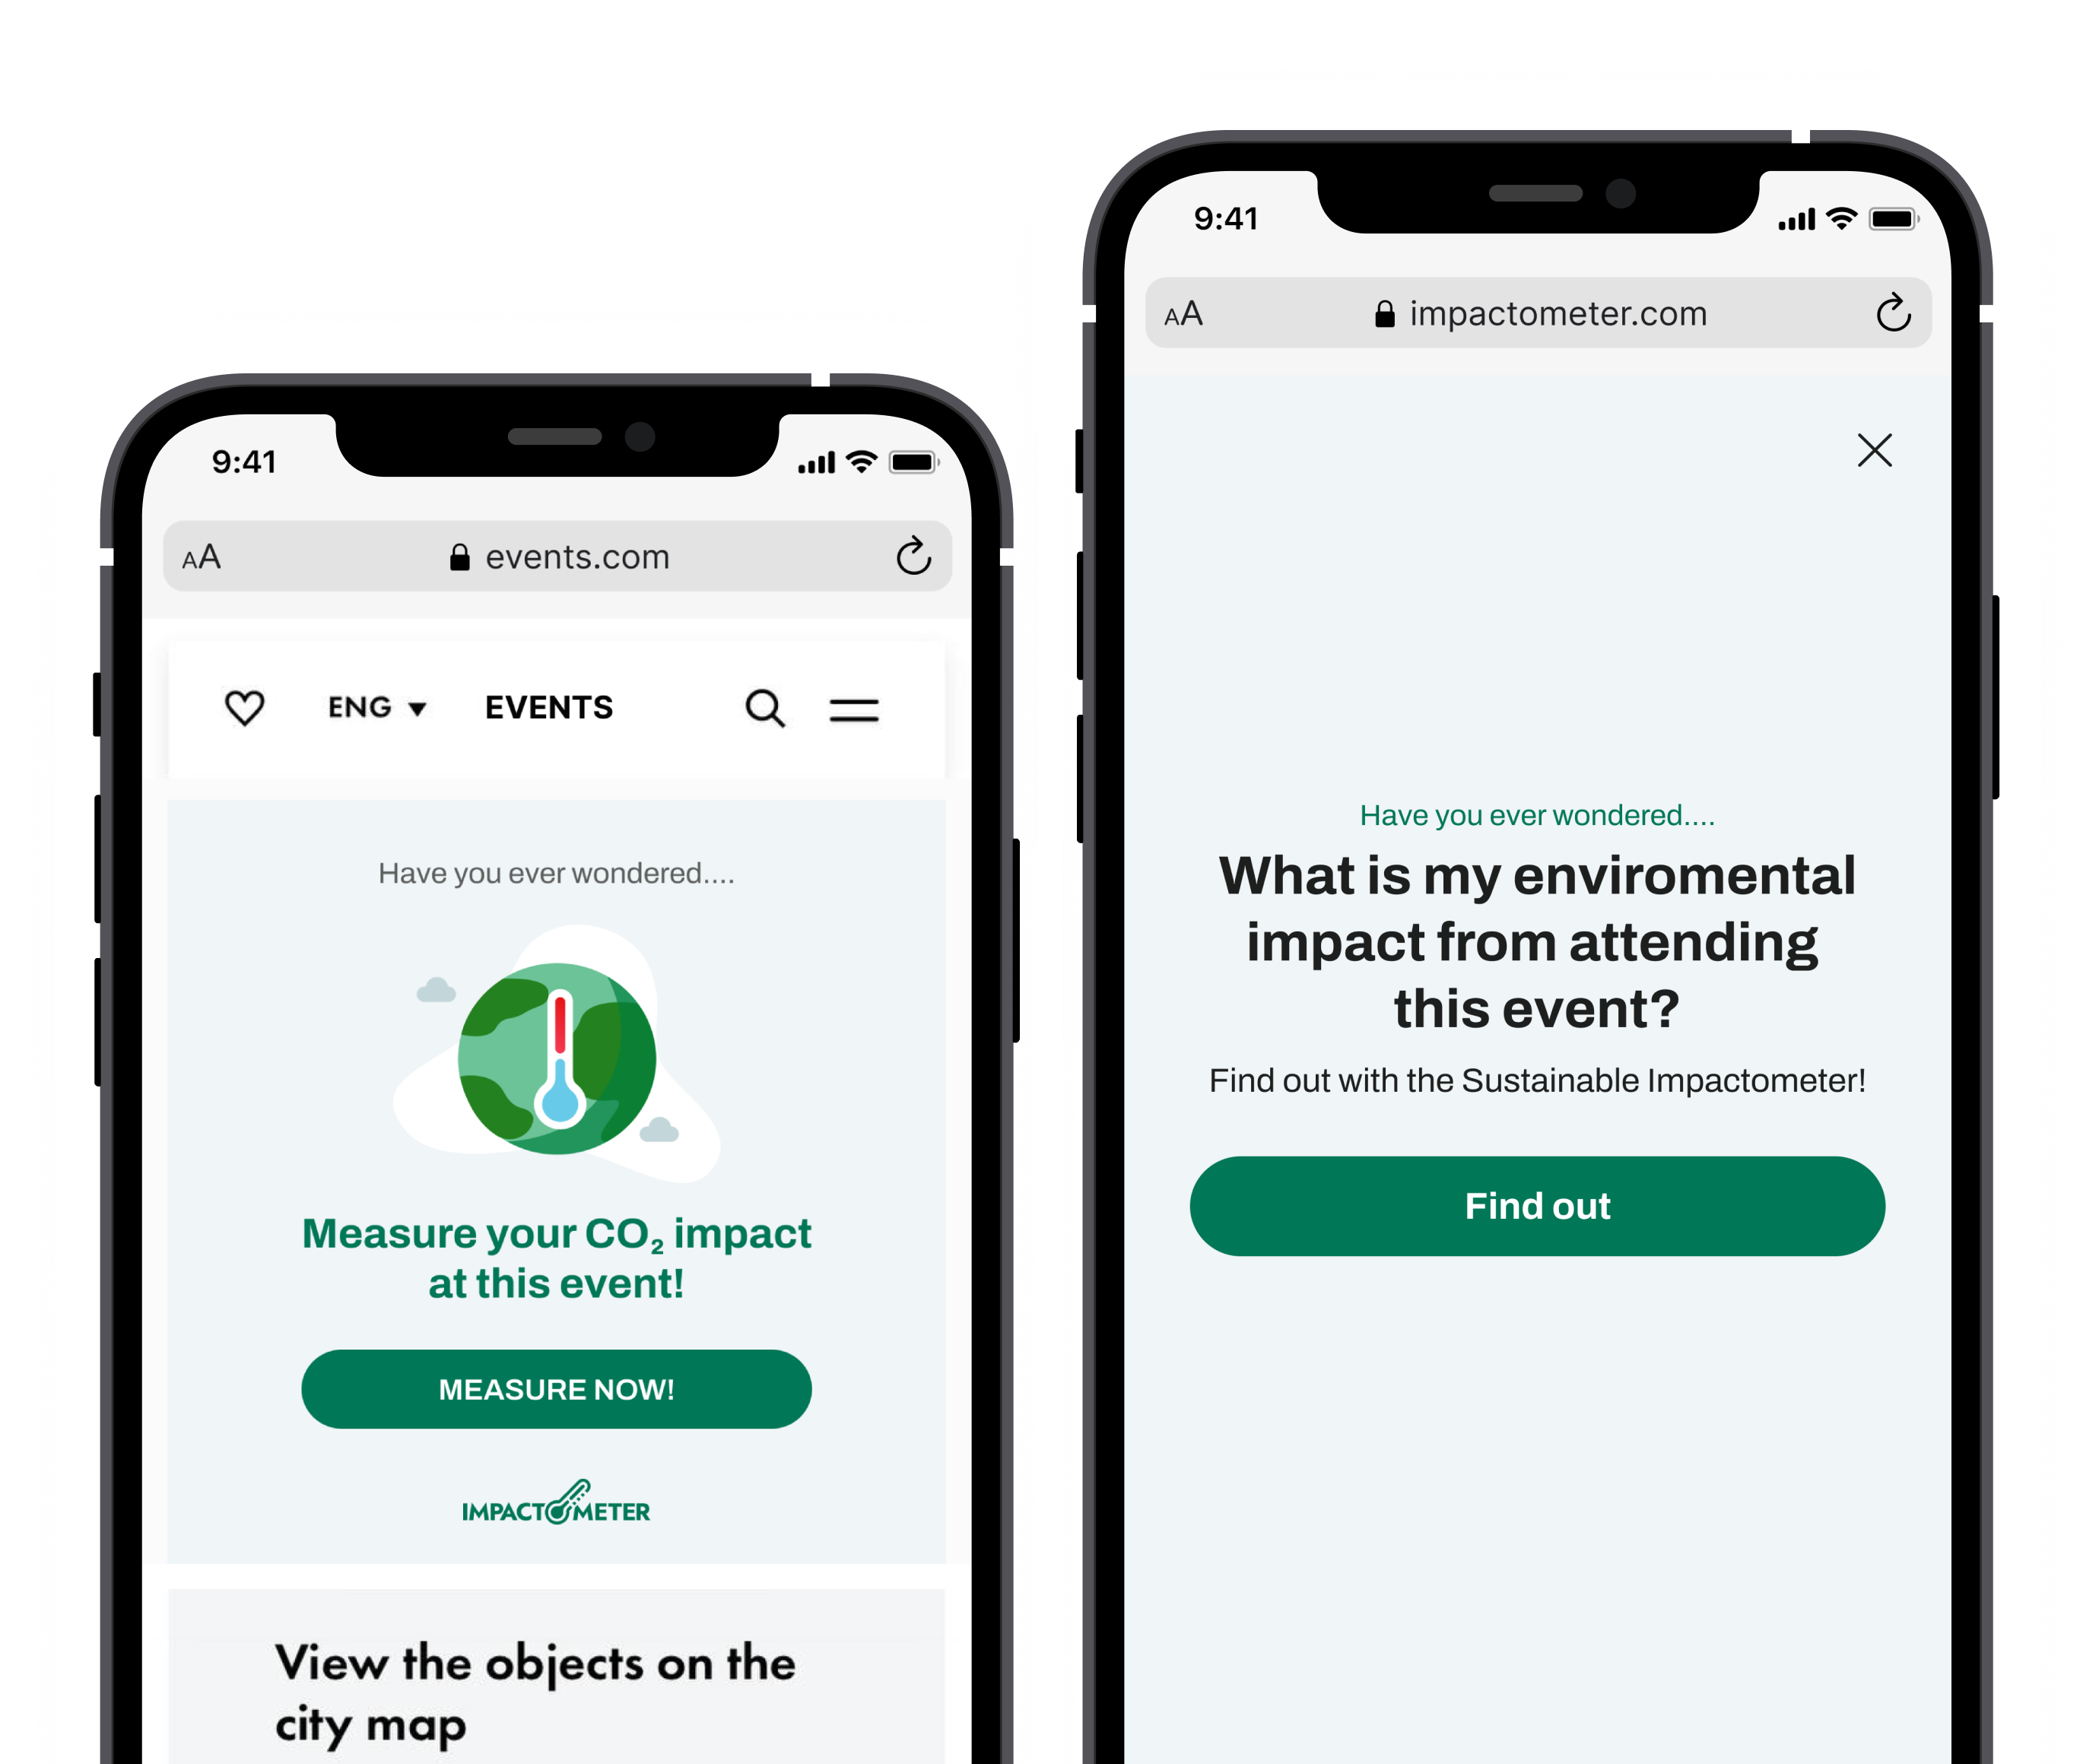
Features of Impactometer
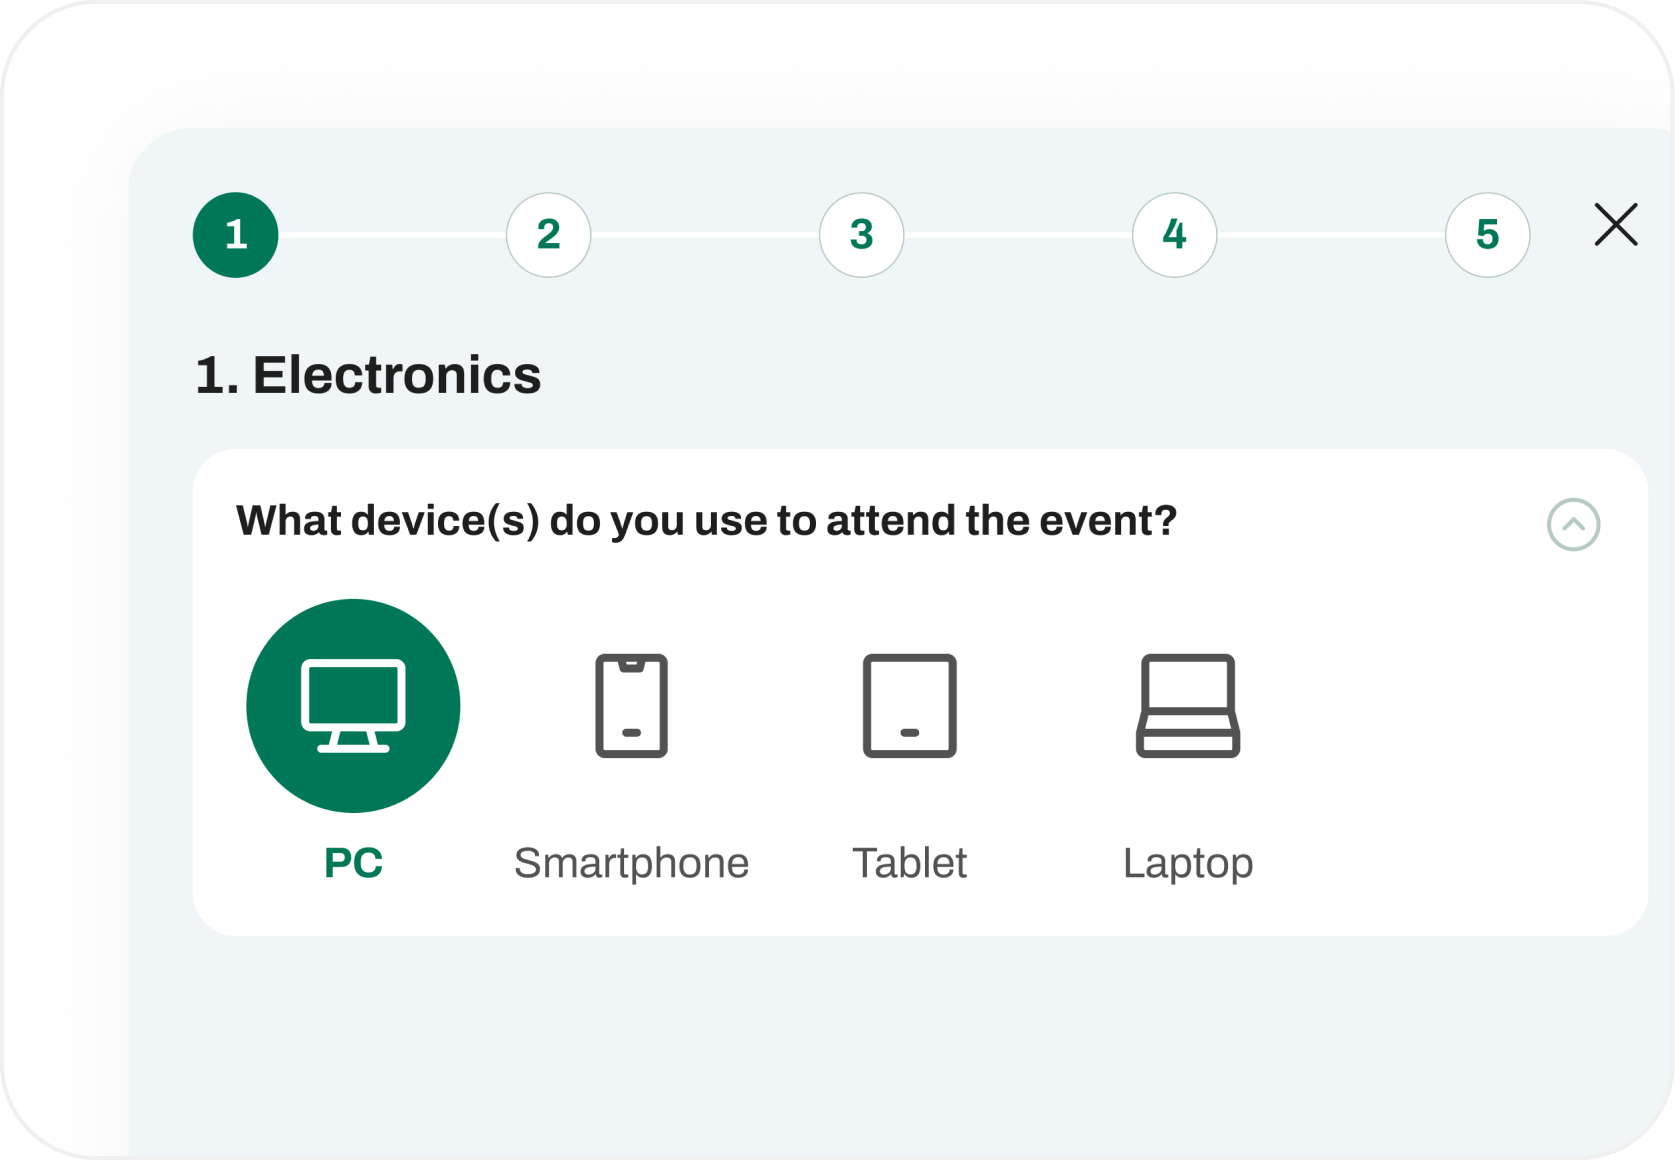
Event participants can take a quick survey directly on the event's website and receive their individual results.
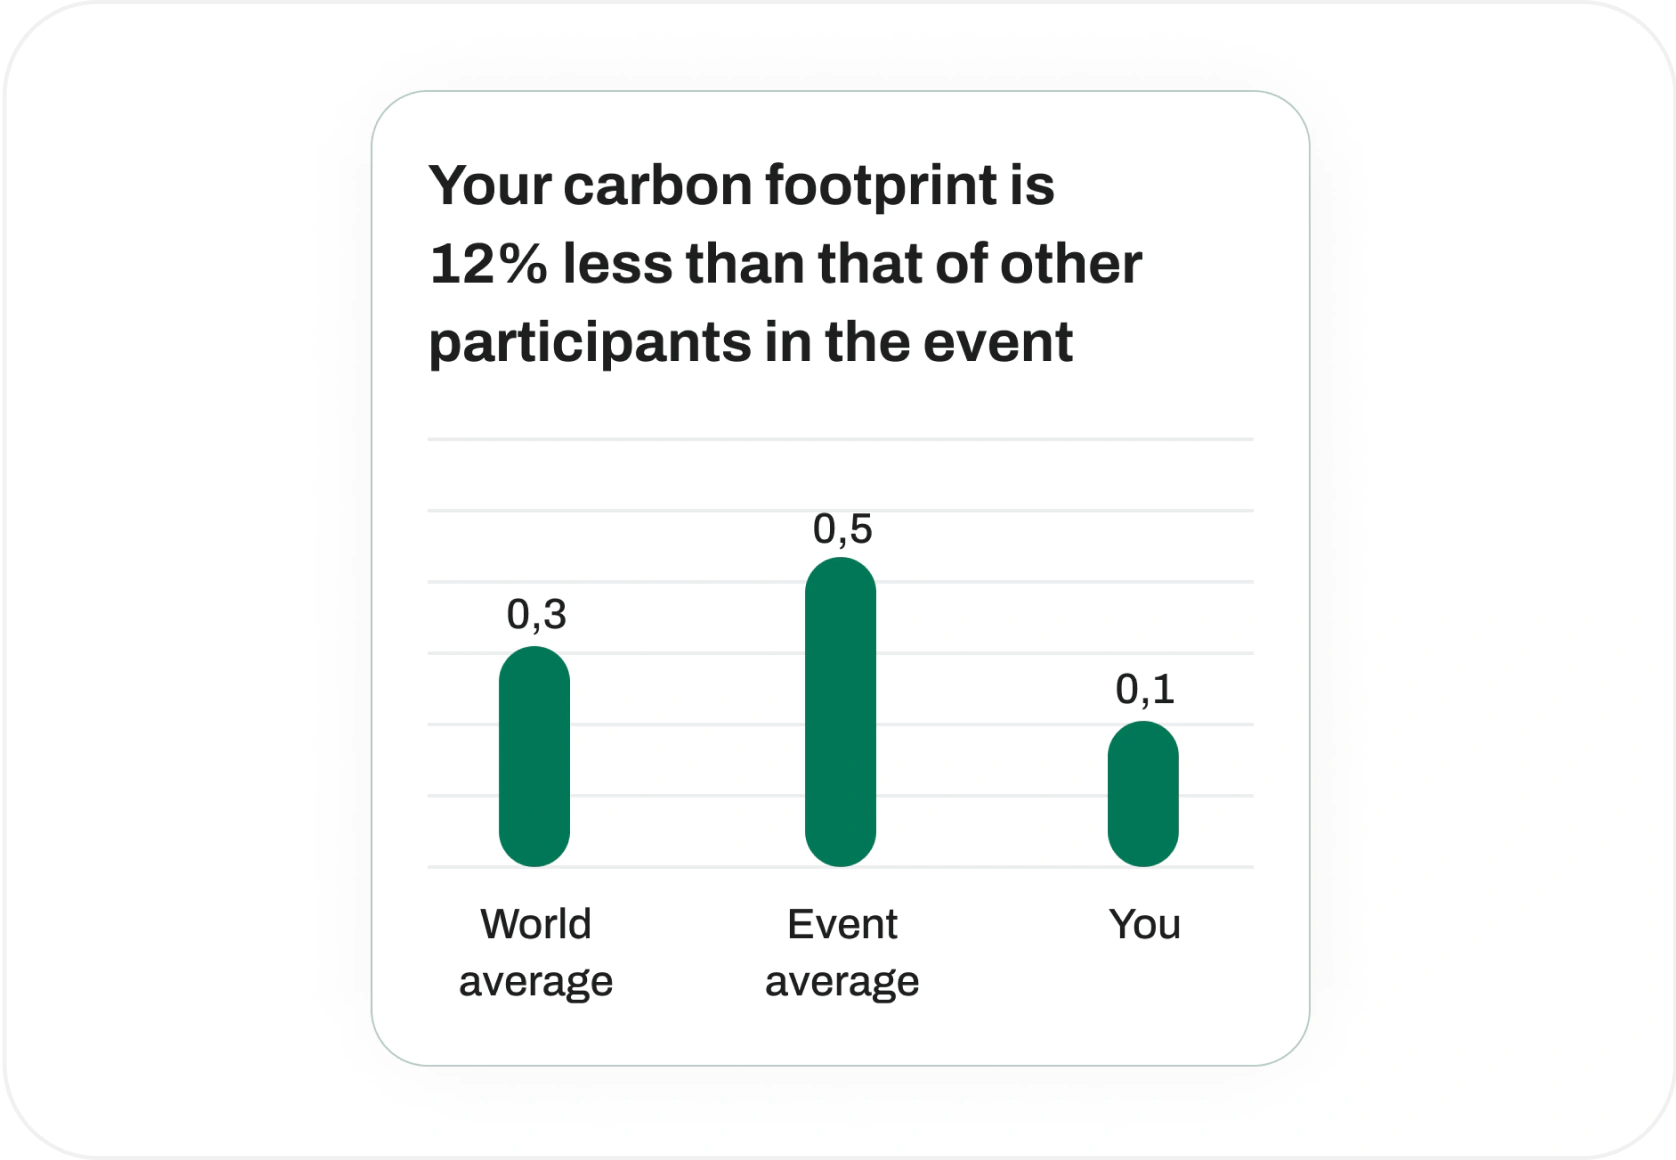
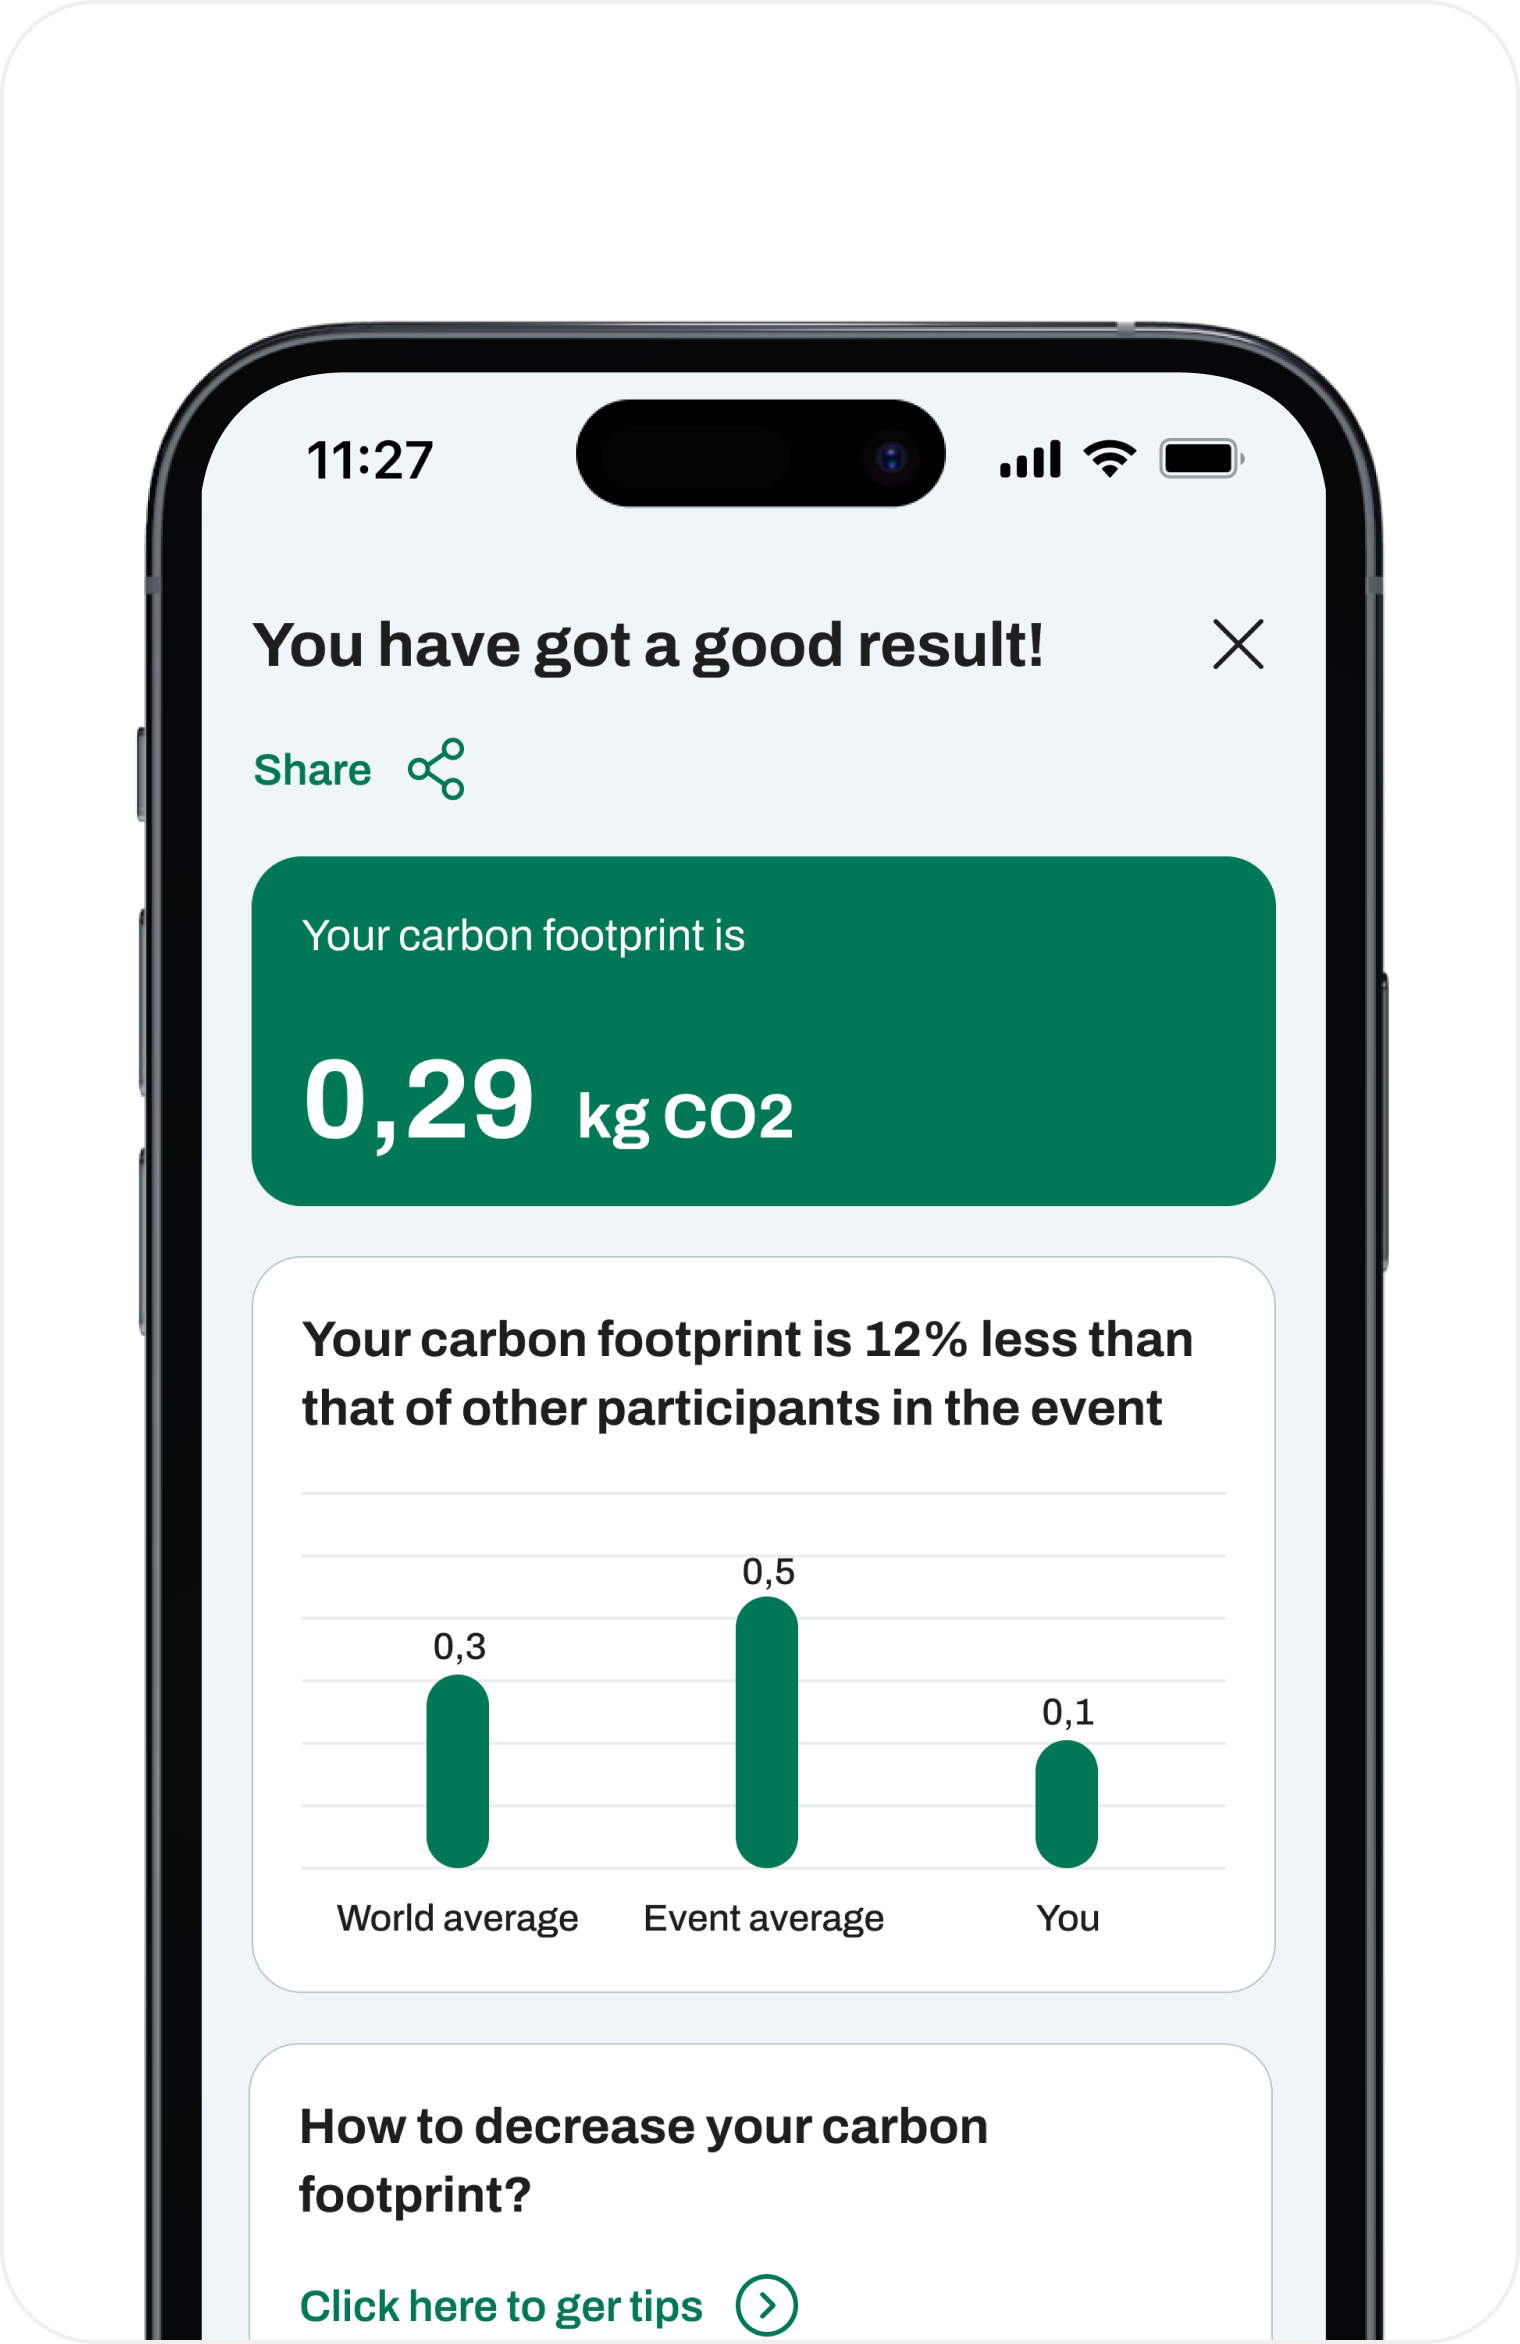
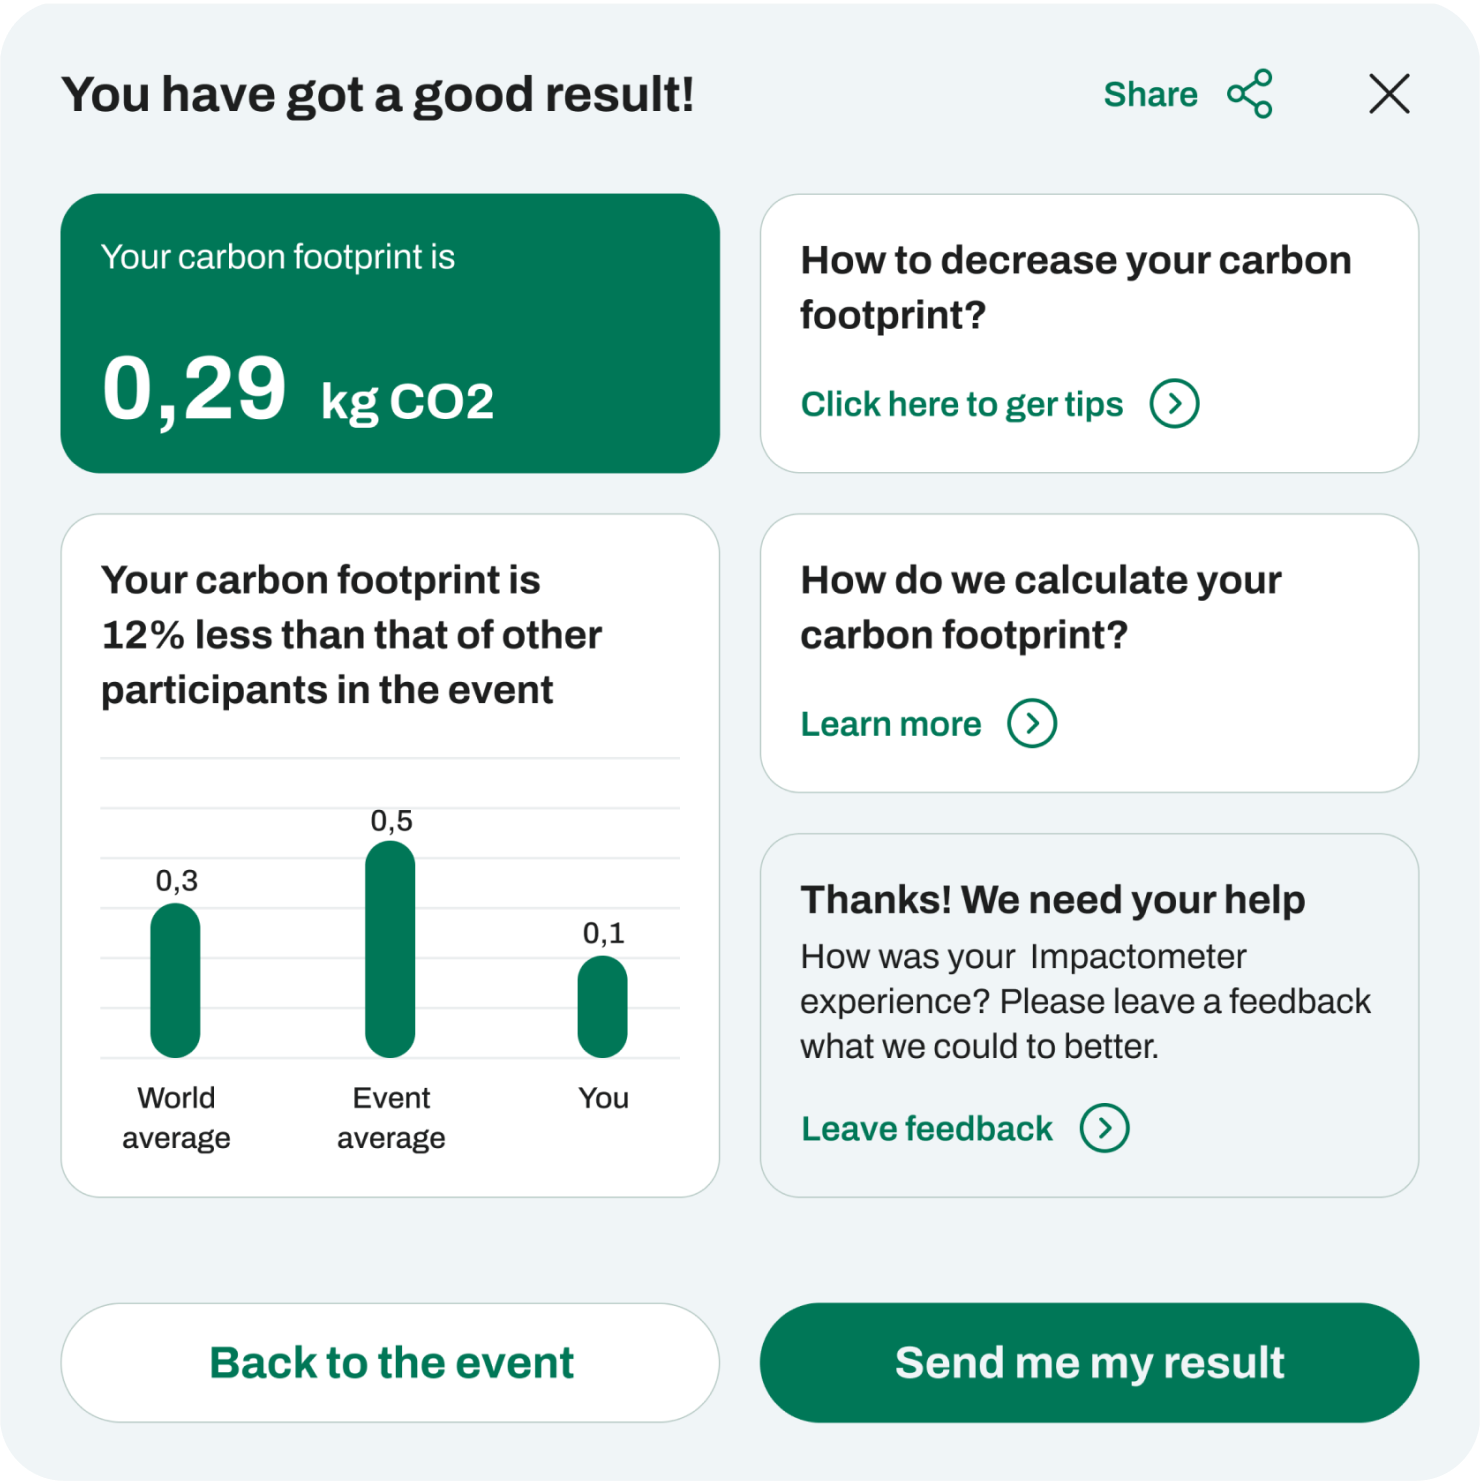
A clear chart shows the ratio of the user's individual result to the event average and global data.
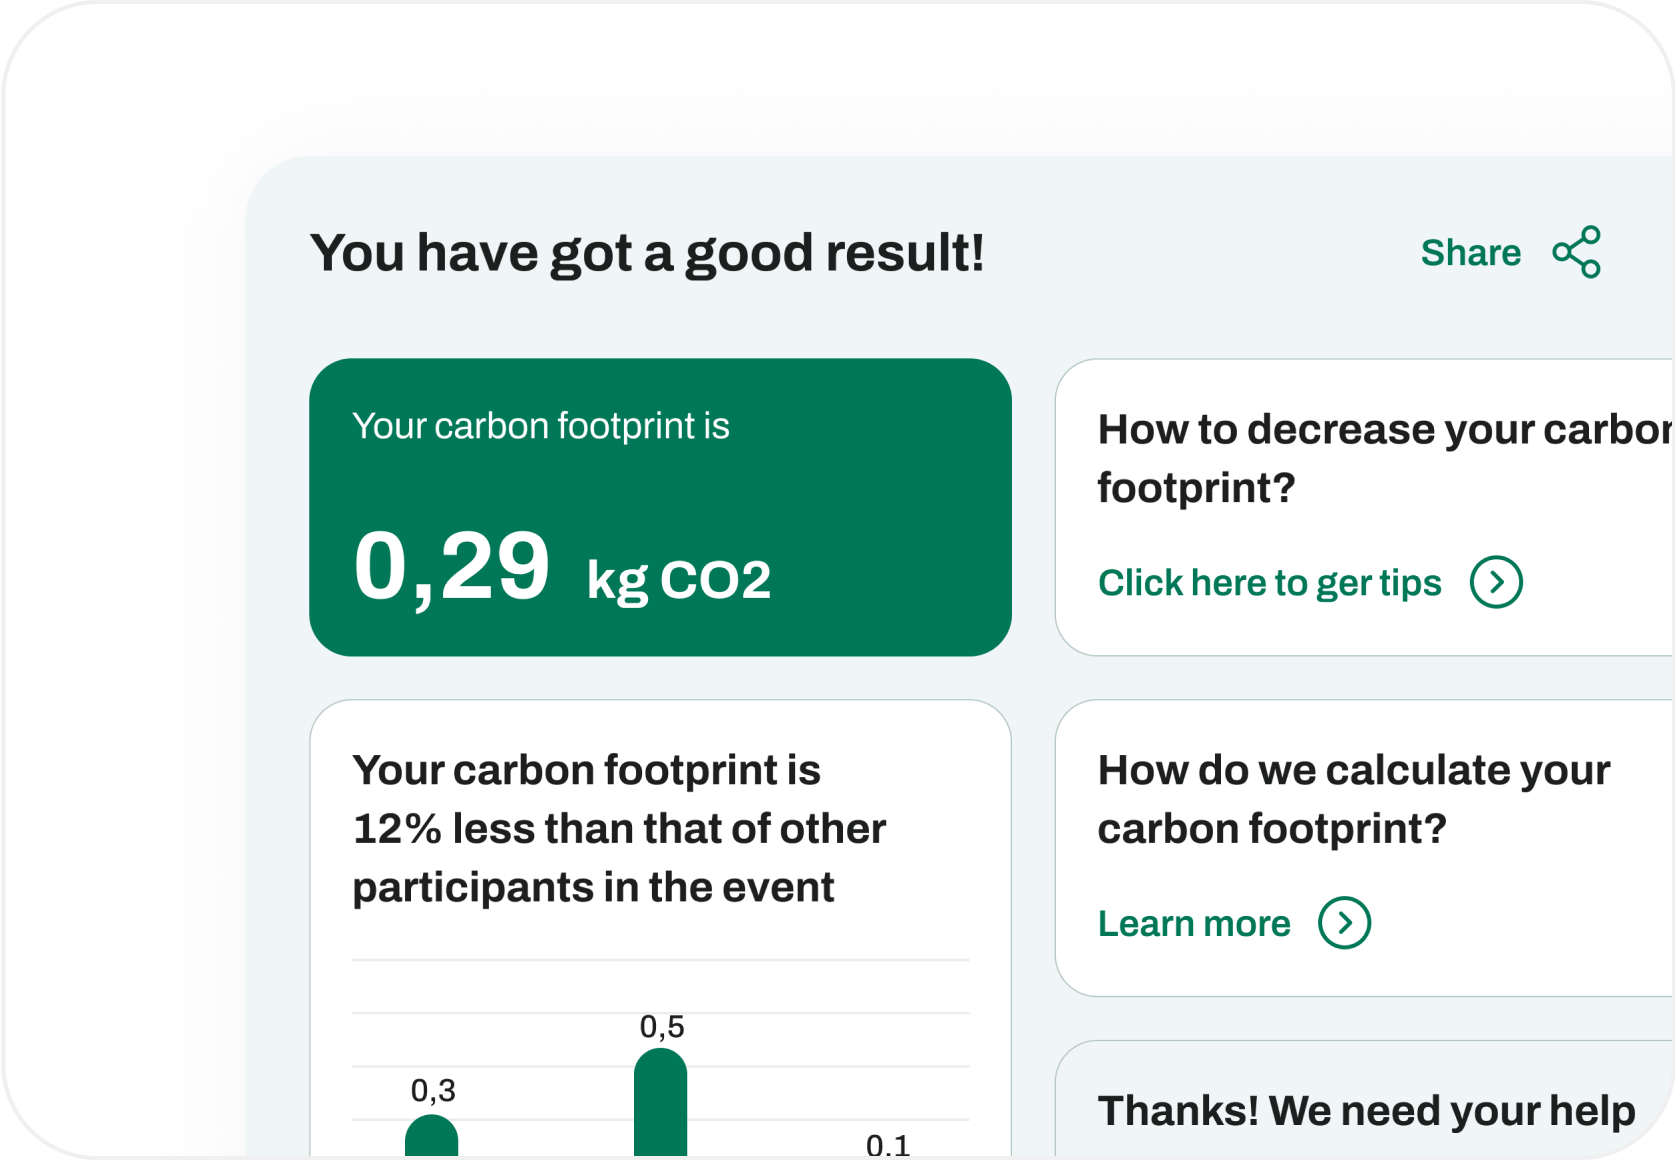
A user-friendly interface makes the widget accessible to all ages and offers insights for sustainable practices.
Technologies
Our team's task was to create the widget itself and an admin panel, allowing the admin to register event organizers who wish to generate their own individual widget. We used the following technologies for this project:


Problem
Events, ranging from small gatherings to large-scale conferences, contribute significantly to carbon emissions through energy consumption, waste generation, and transportation. Despite this, many attendees remain unaware of the environmental impact of their participation.
Awareness is key to reducing environmental impact. By knowing their carbon footprint, attendees can see how their actions contribute to emissions and be motivated to embrace more sustainable practices.
Personal responsibility plays a significant role in sustainability. This sense of responsibility can drive individuals to make conscious choices, such as opting for greener transportation options or minimizing waste.
Diverse energy sources used at events and the lack of accessible data make it challenging for individuals to accurately assess their personal impact. Without technological assistance, capturing the detailed nuances of energy consumption emissions becomes an overwhelming task.
Solution
The widget is aimed to address the challenge of raising awareness about personal carbon contributions during events. By providing real-time data on an individual's carbon footprint, based on various parameters tailored to a specific event, the widget empowers users with actionable insights. By fostering awareness at a personal level, it encourages attendees to adopt more sustainable behaviors, ultimately contributing to a collective effort in reducing carbon emissions.

Target audience
The TA includes event organizers who are eager to demonstrate their commitment to green initiatives. The widget also appeals to eco-responsible organizations that value transparency in their environmental impact and aim to inspire others to follow suit. Event attendees, who are conscious about living a more sustainable lifestyle, also form a key part of the audience, as they are motivated by the desire to make informed, eco-friendly choices.
Available functionality for the user
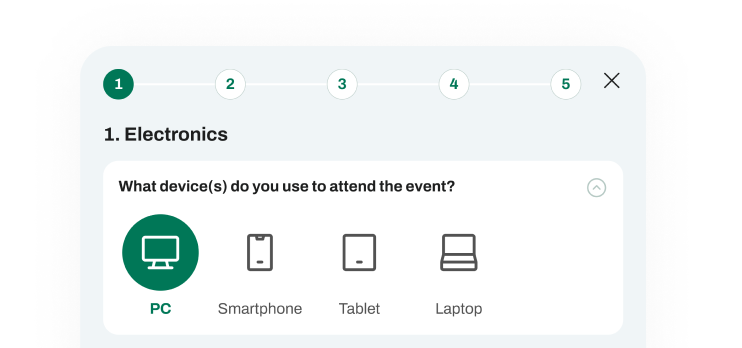
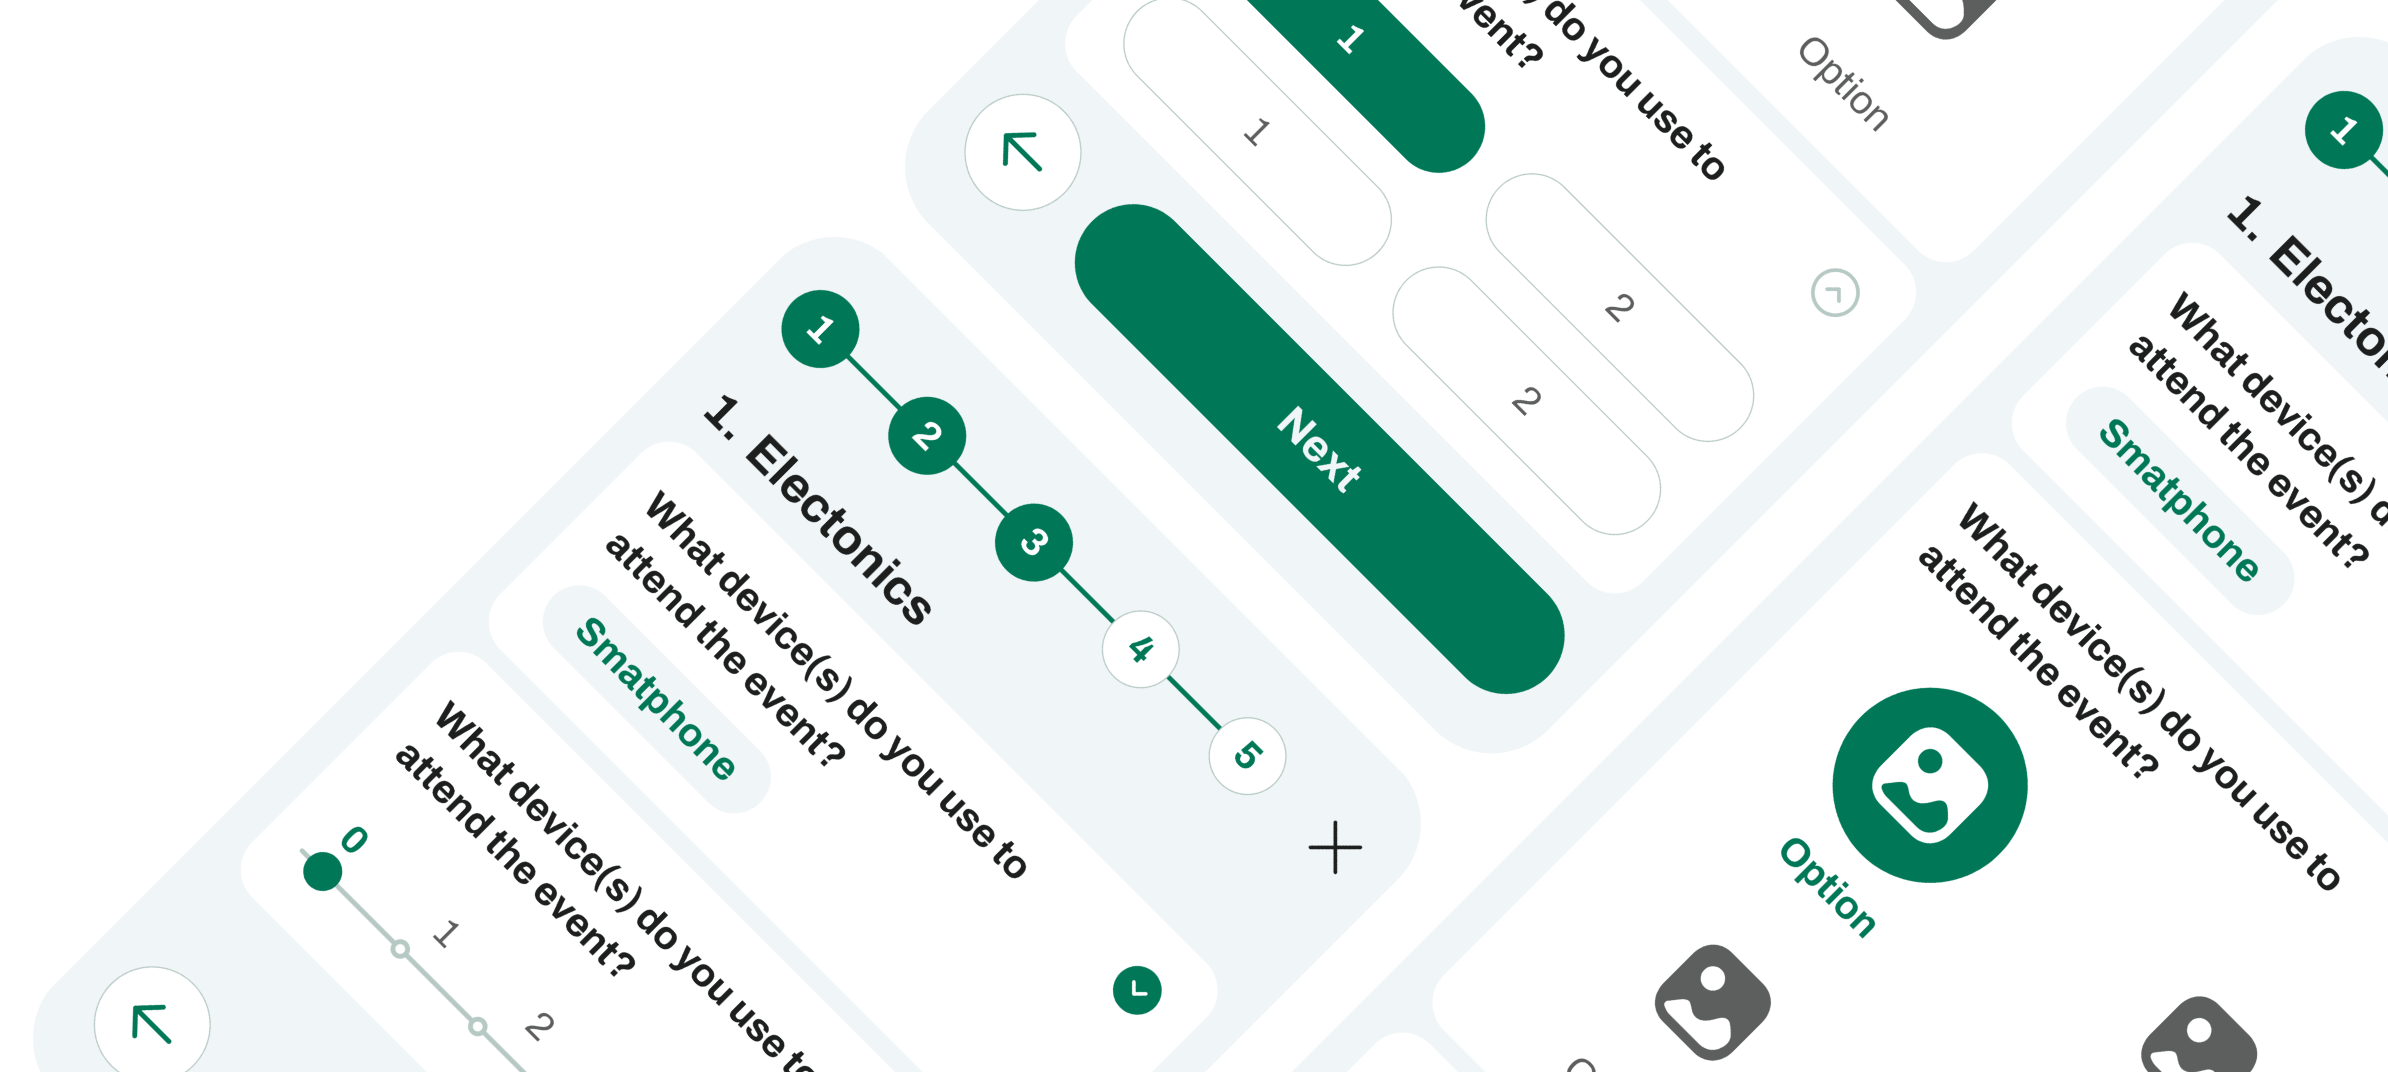
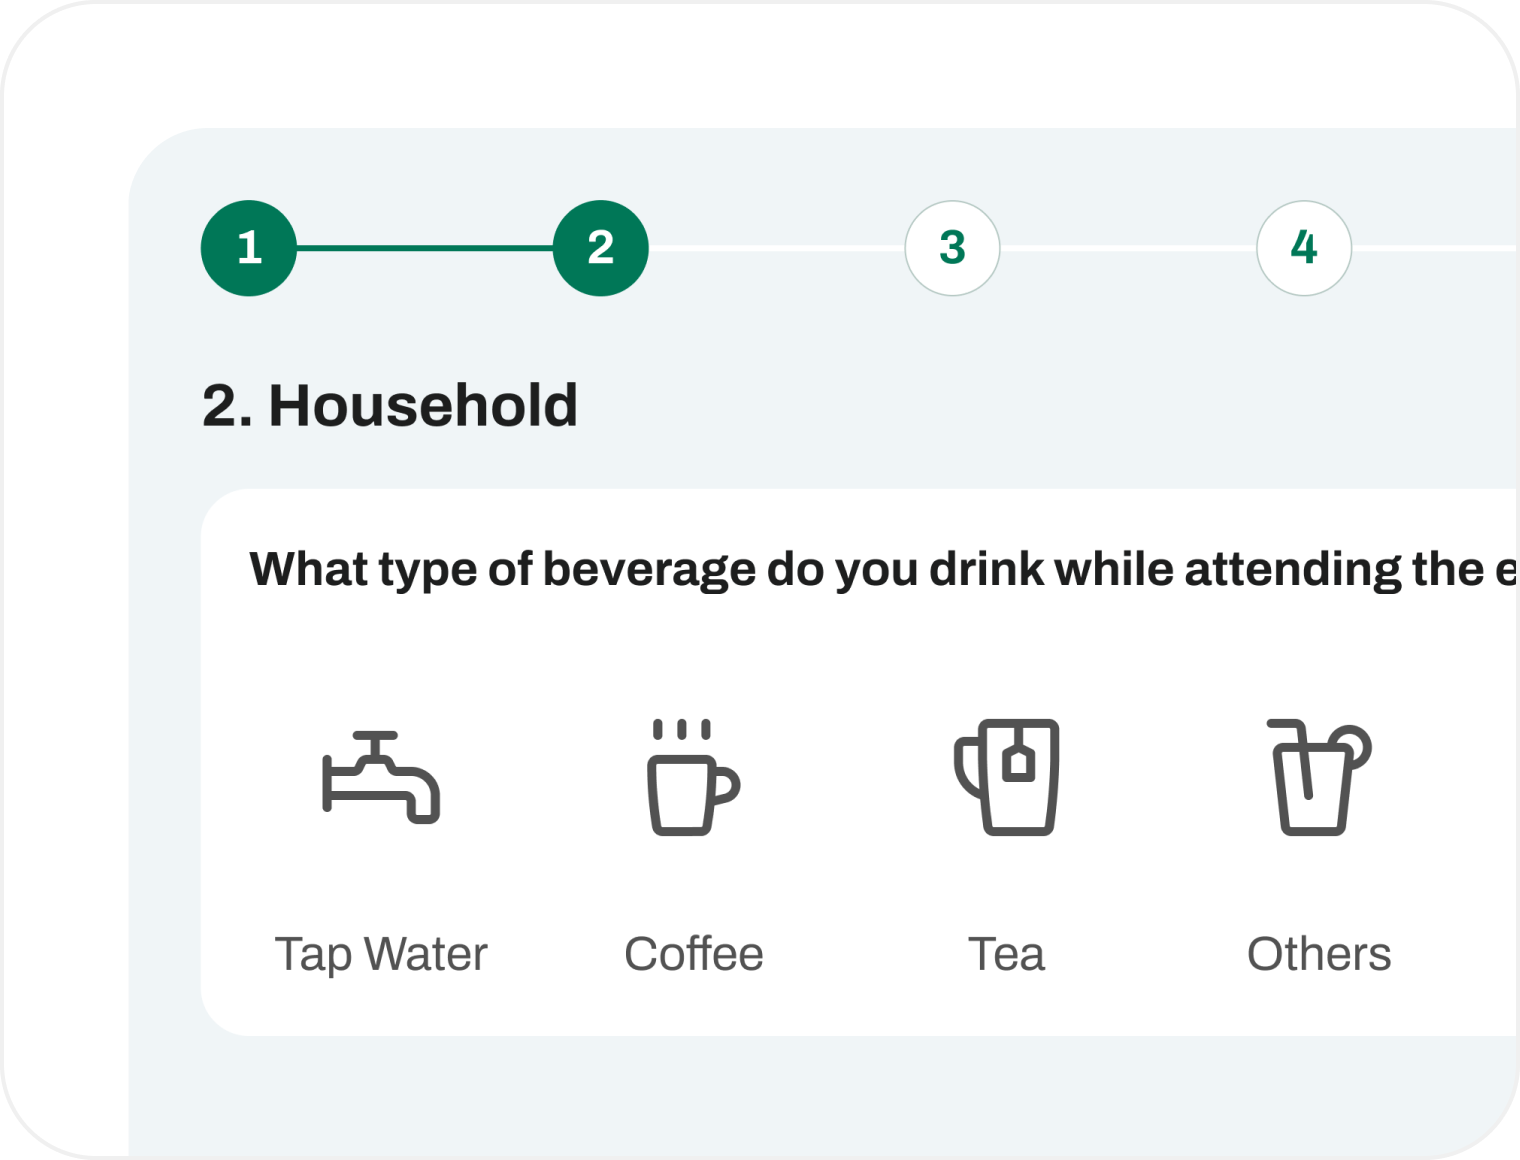
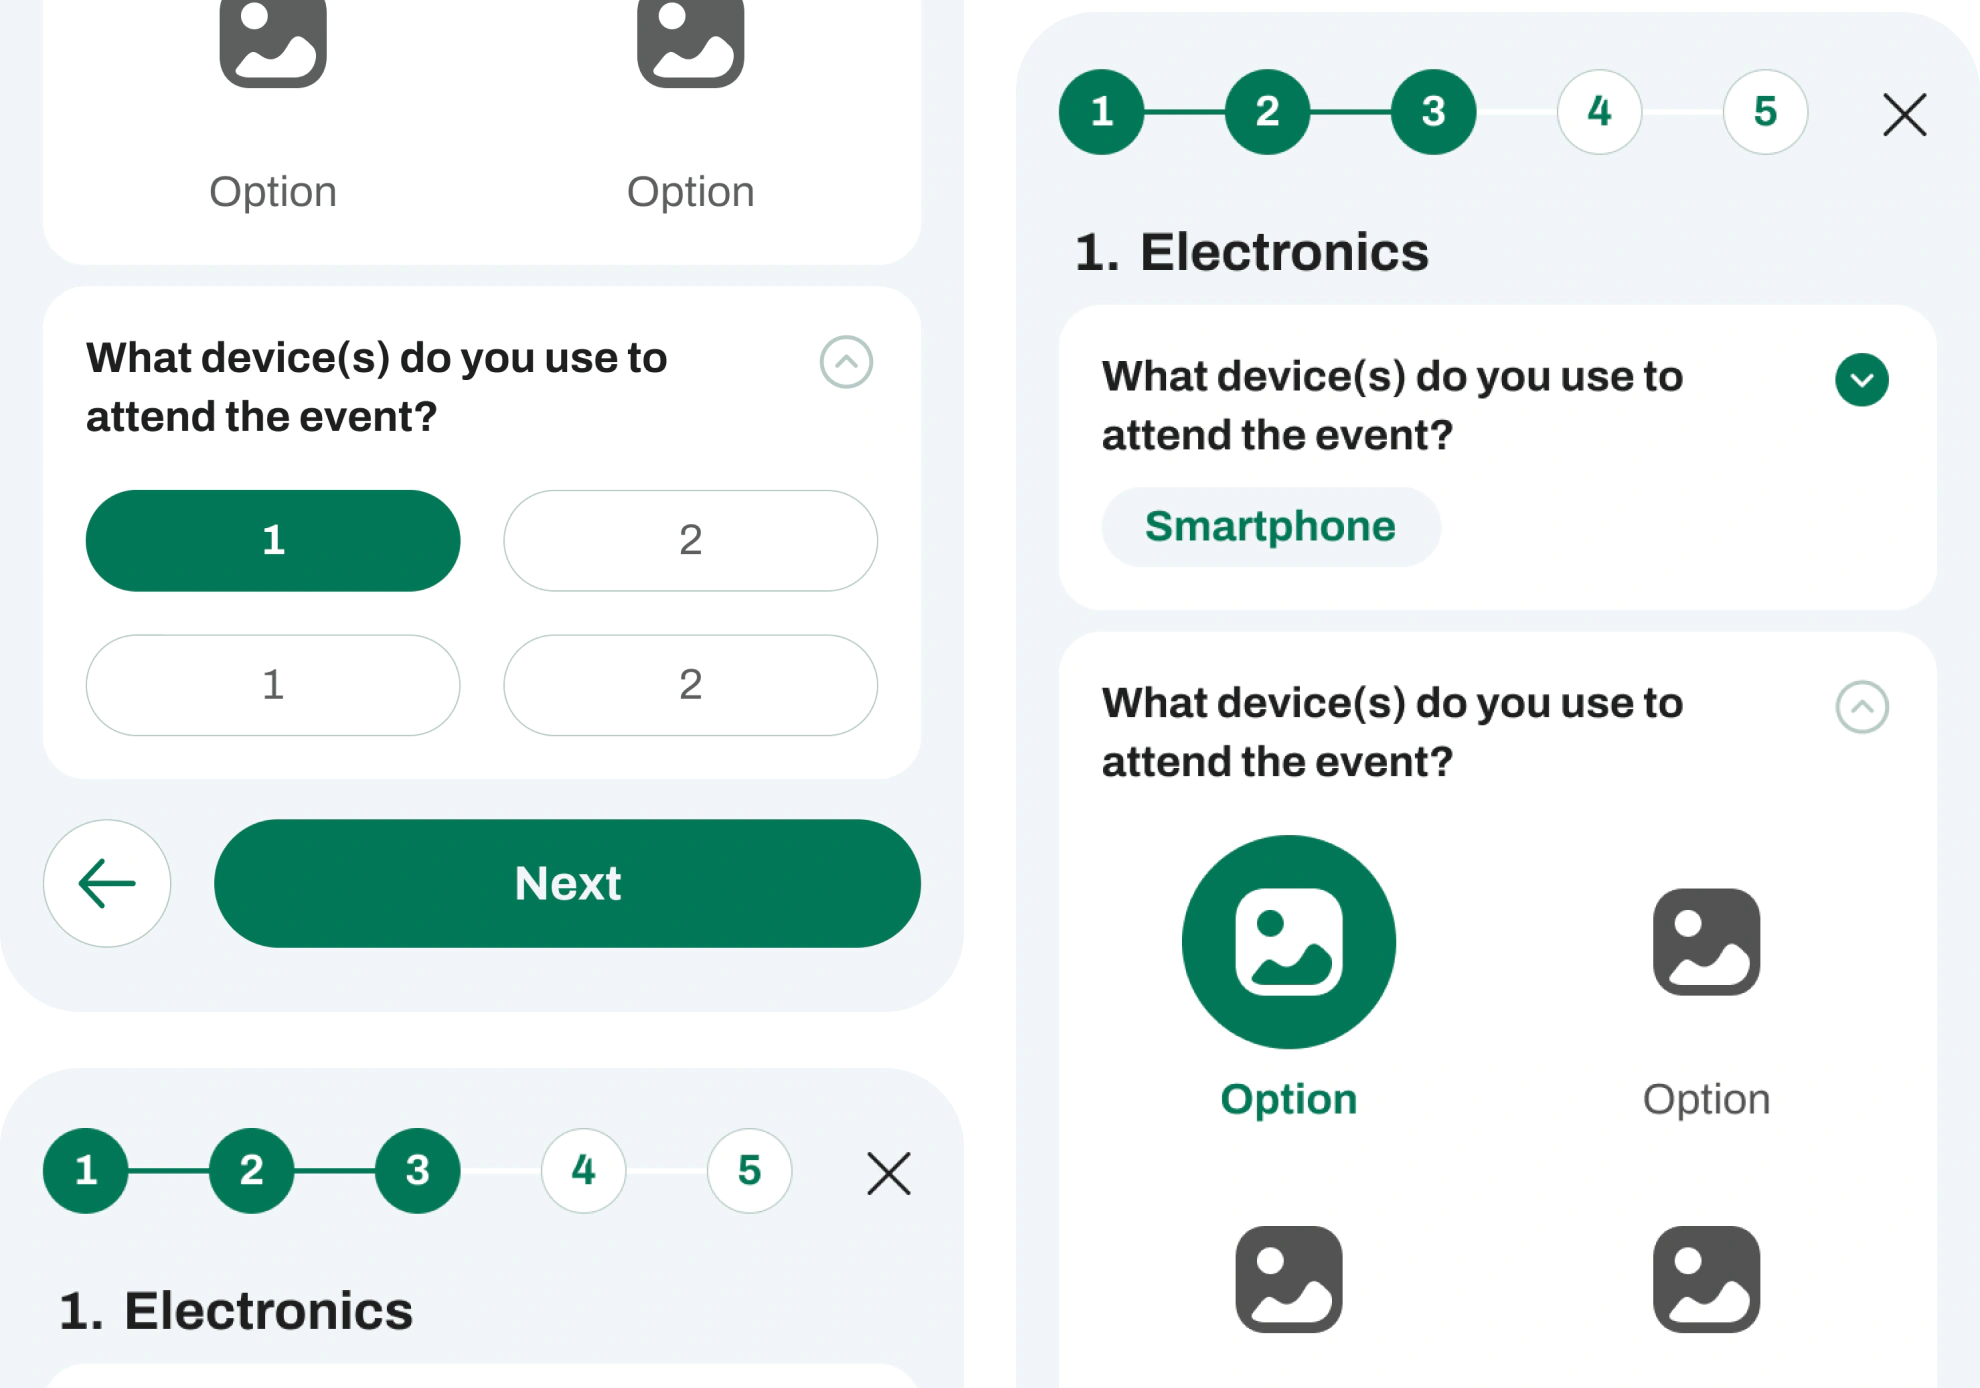
Users complete a quick test, selecting answers from a range of offered variants.
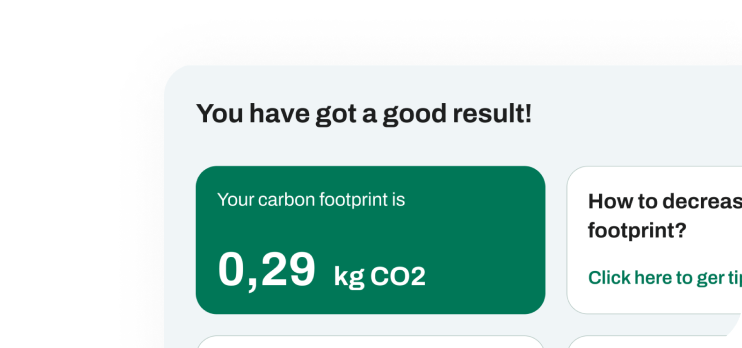
The widget provides a clear overview of individual carbon footprints. An actual number without any clutter!
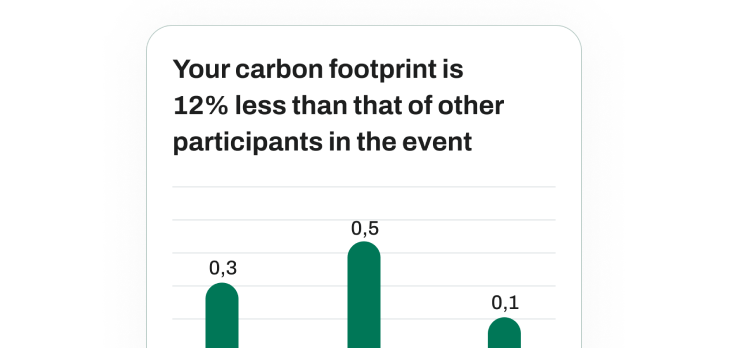
The chart offers visual representation of carbon emissions in an easy-to-understand format.
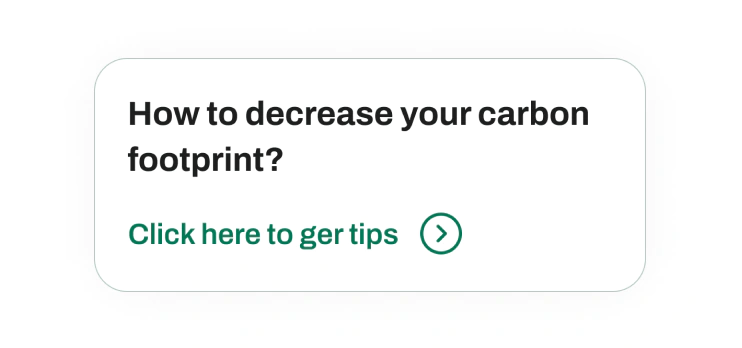
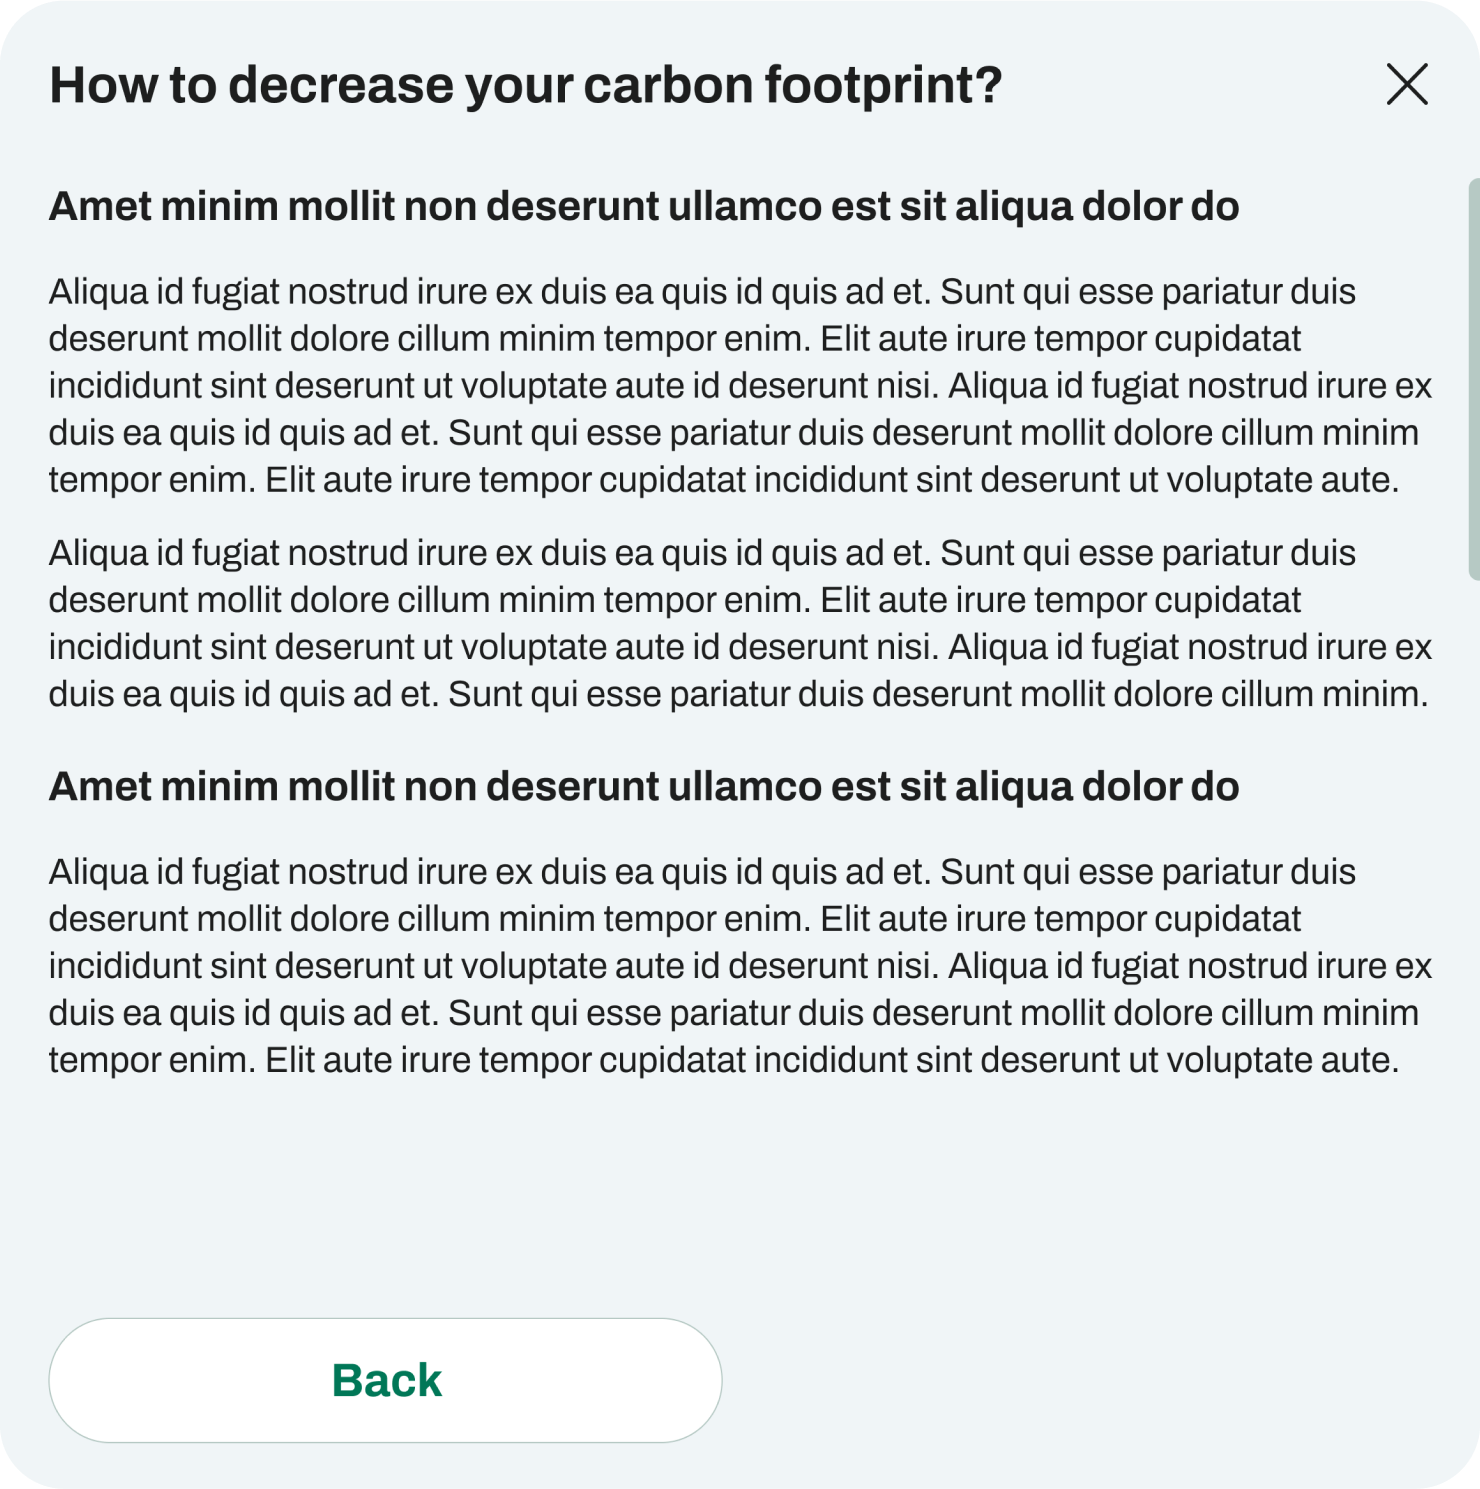
Along with the result, users get useful tips and practical strategies on how to reduce emissions.
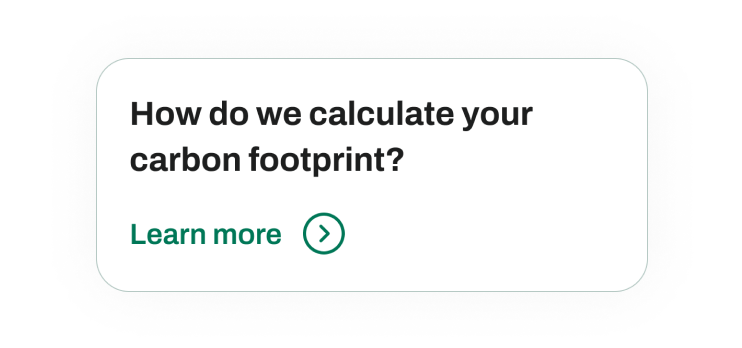
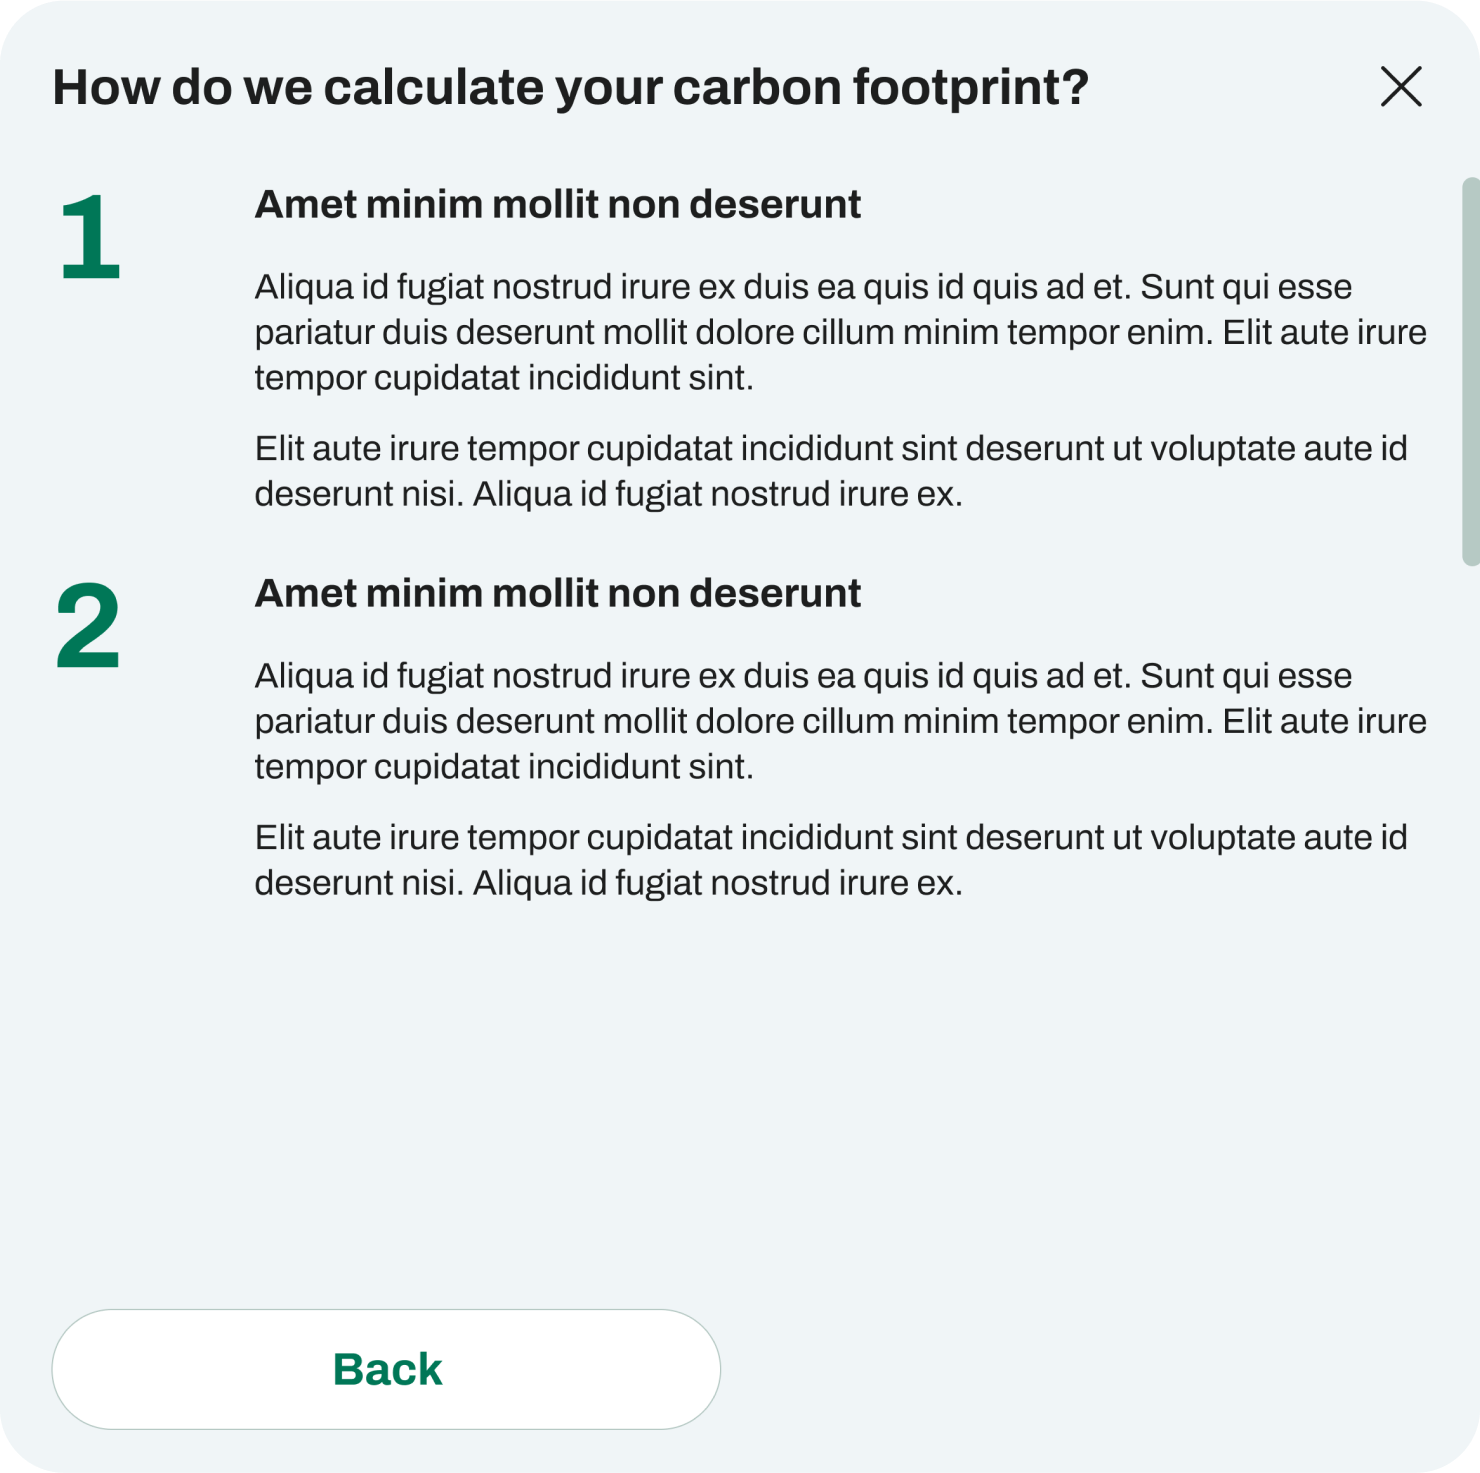
Users can read more about the methodology and data sources used to calculate emissions accurately.
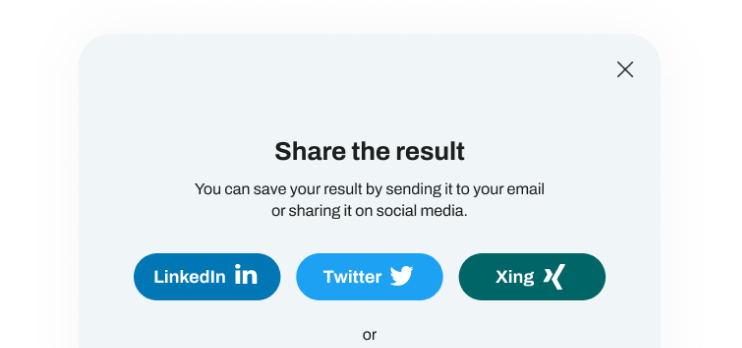
The social media sharing functionality encourages wider discussions on sustainability.
How it works
The widget is individually generated for each company (event organizer) separately. The list of questions for users is compiled based on the specific event and the factors involved.
The event organizer inserts the code on the website, after which the widget becomes visible to website visitors (i.e. event attendees). By clicking on the widget, users are invited to take a short test that will only take a couple of minutes.

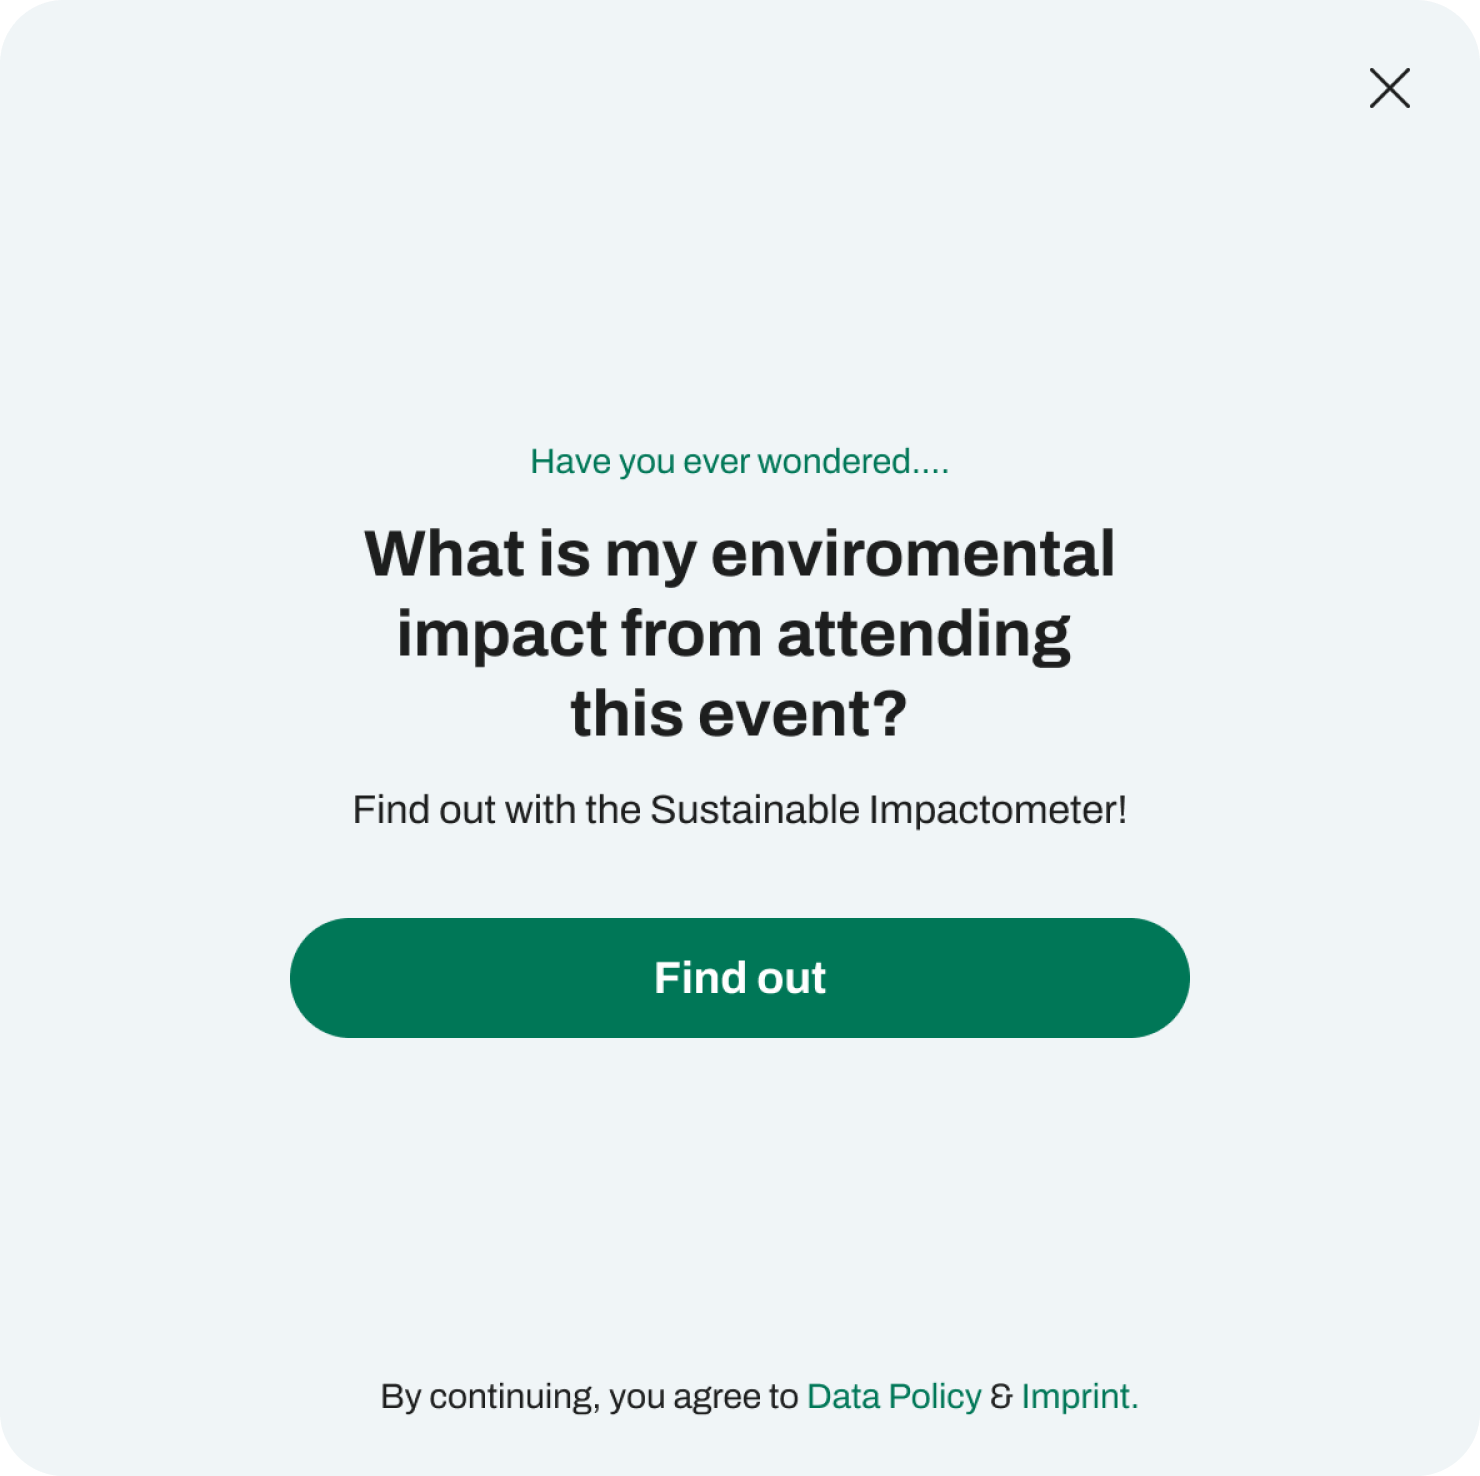

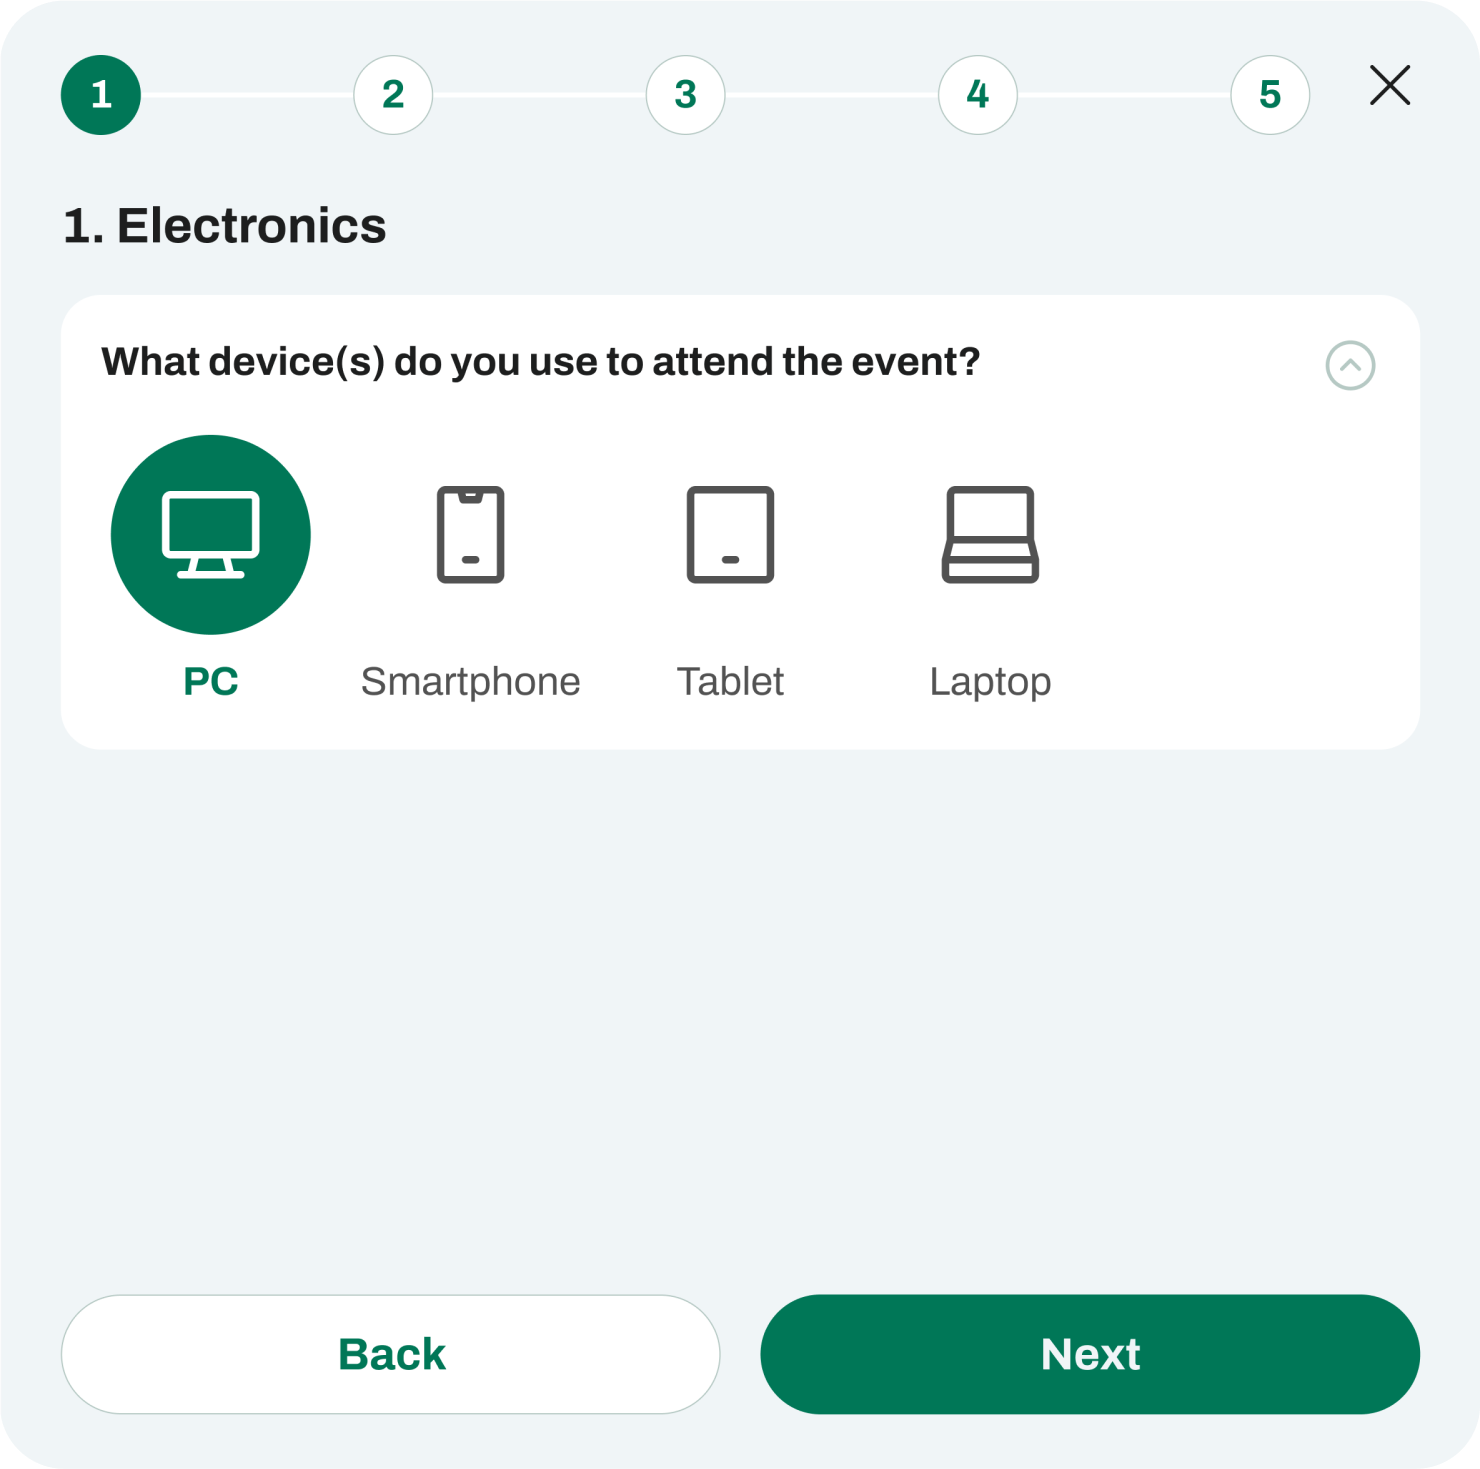

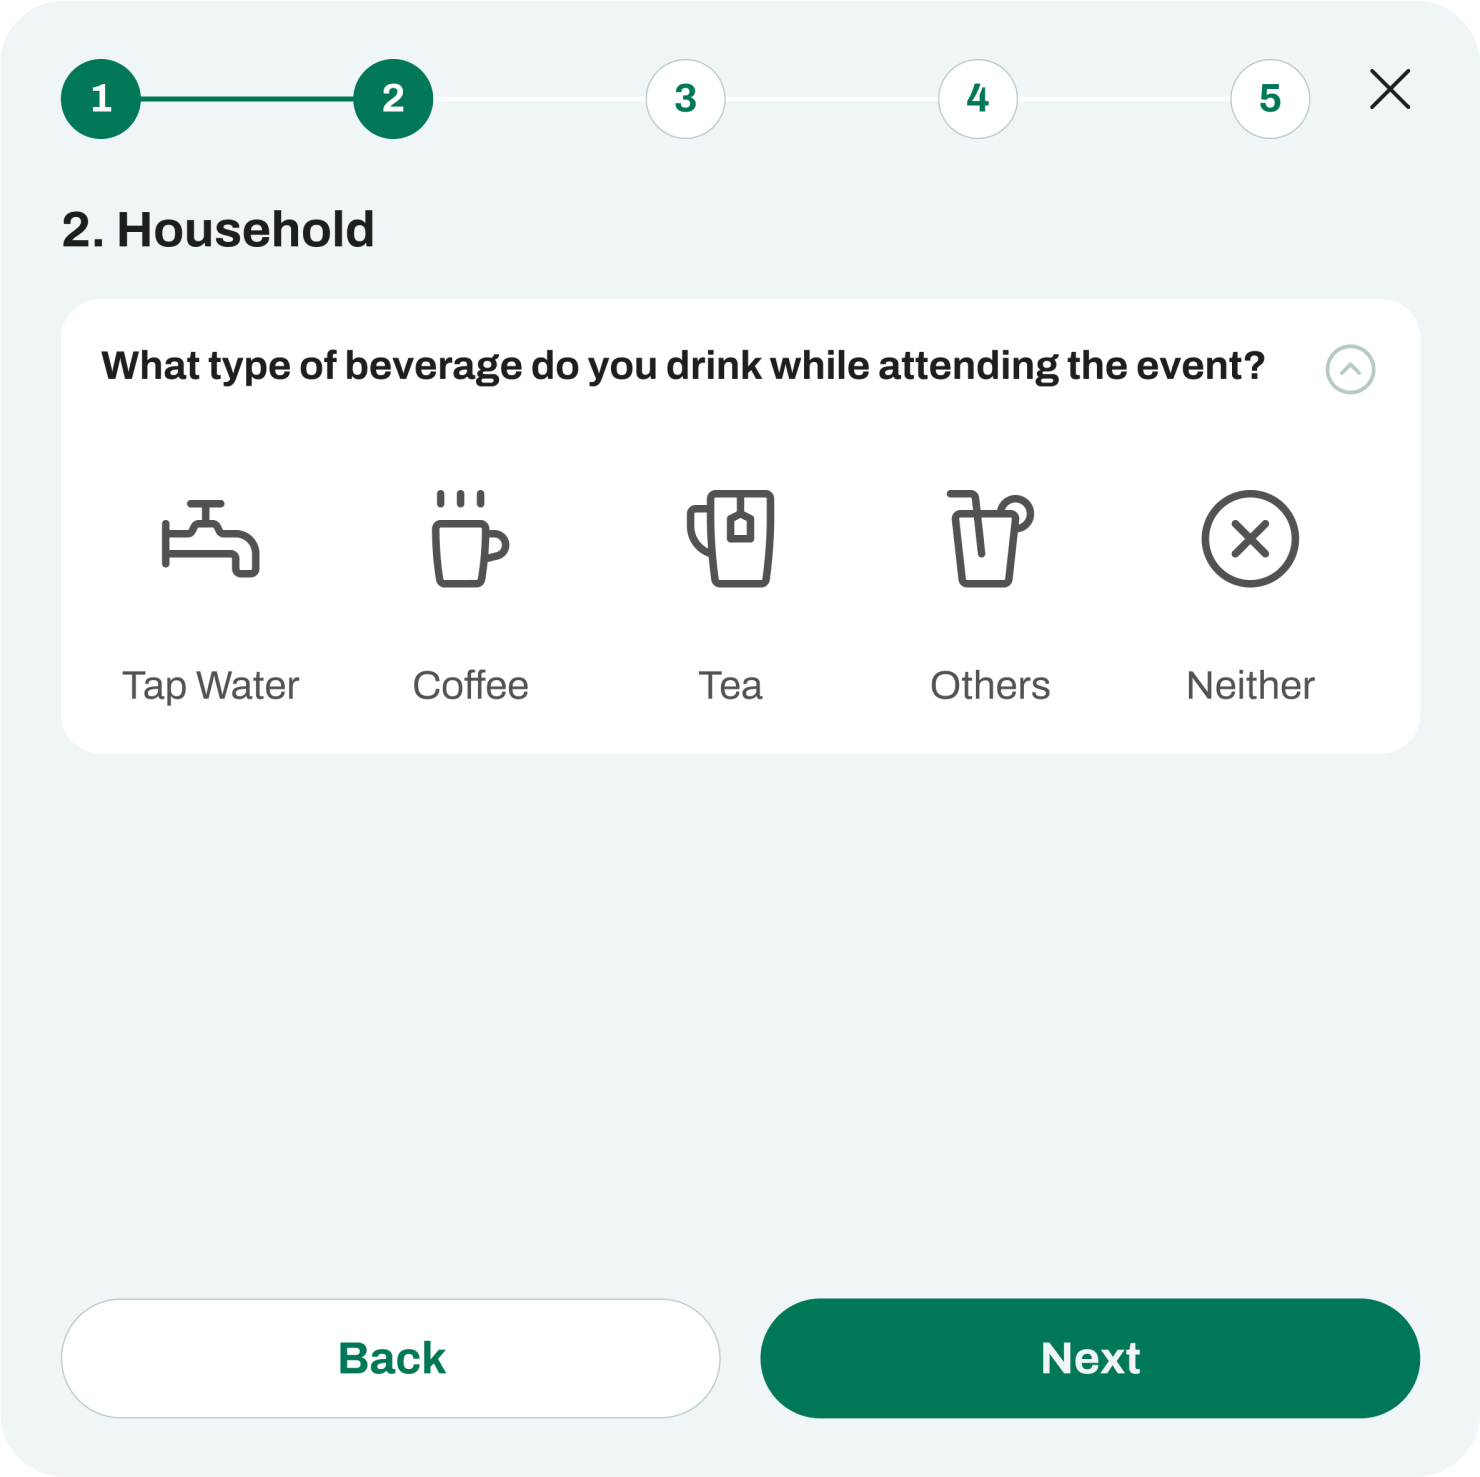

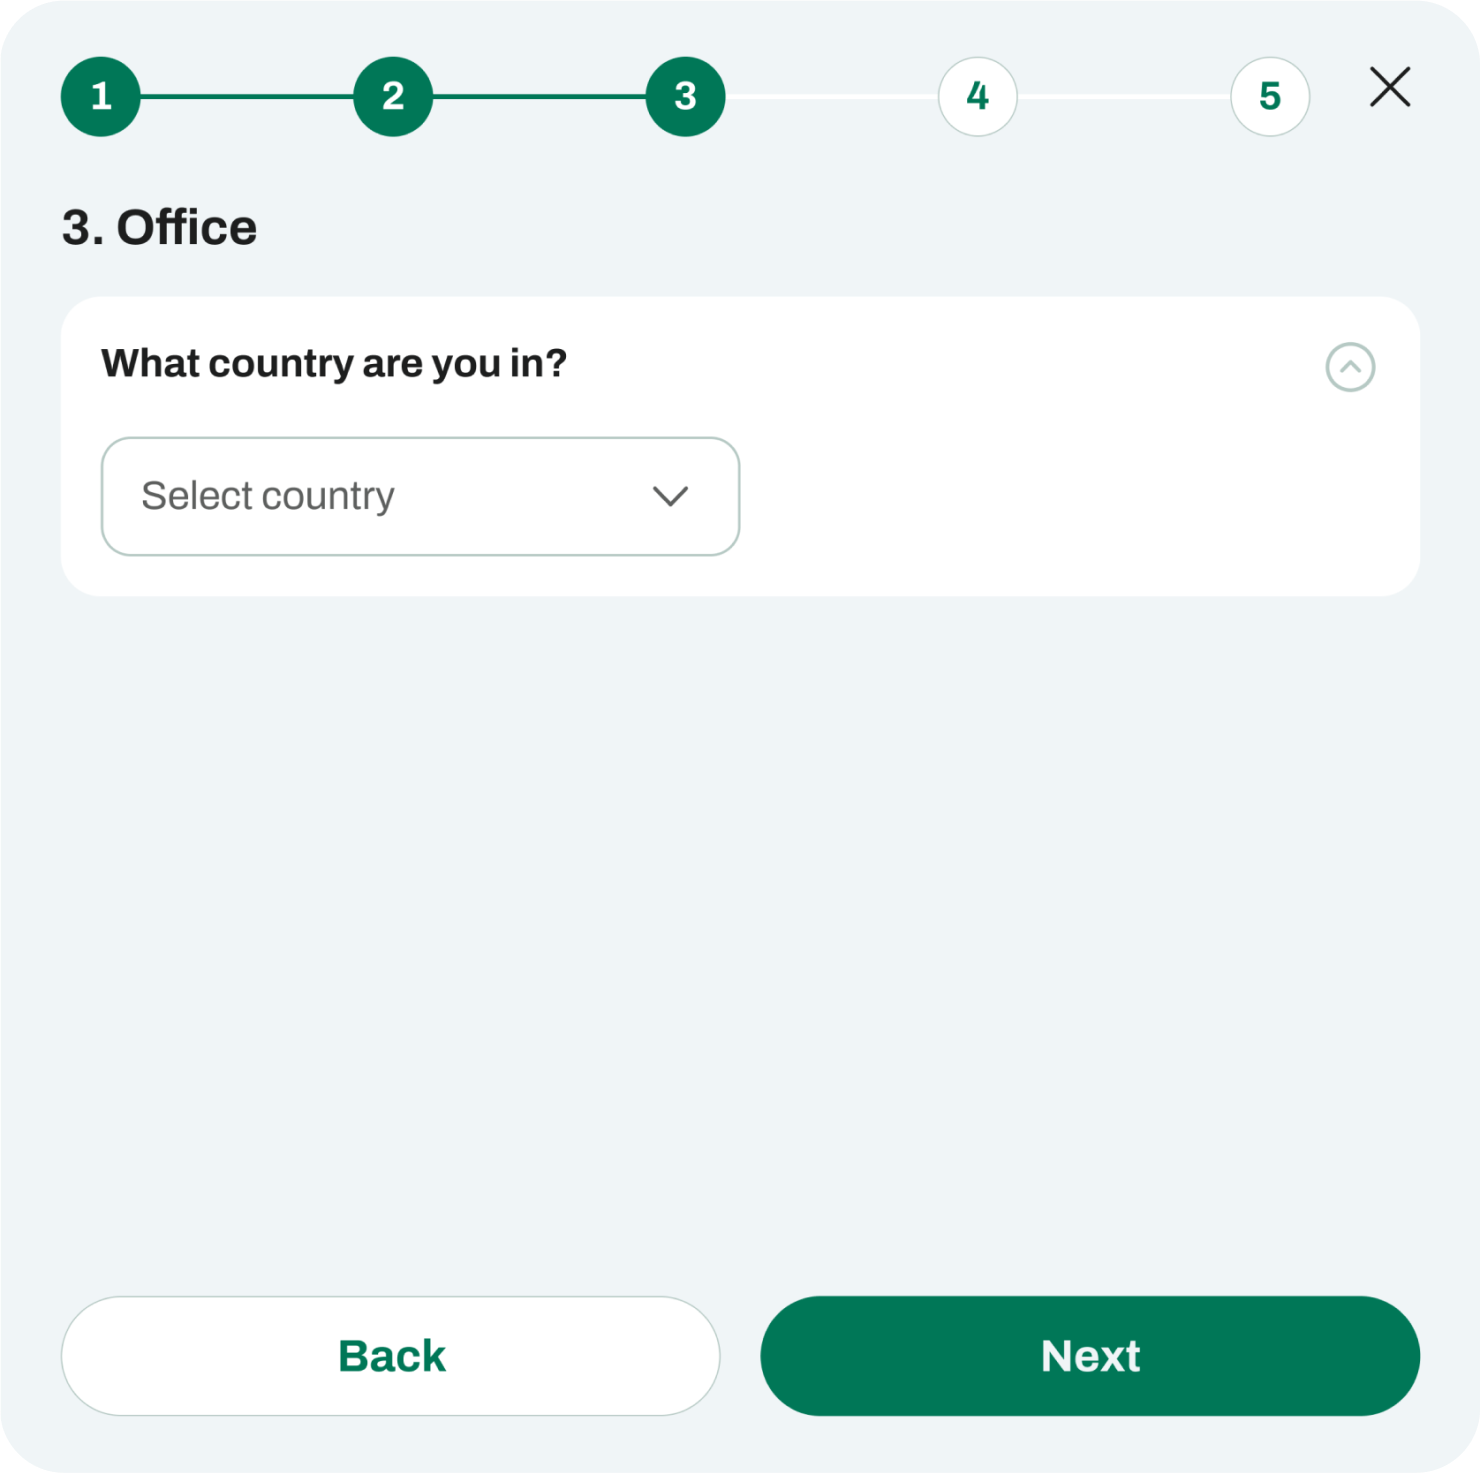

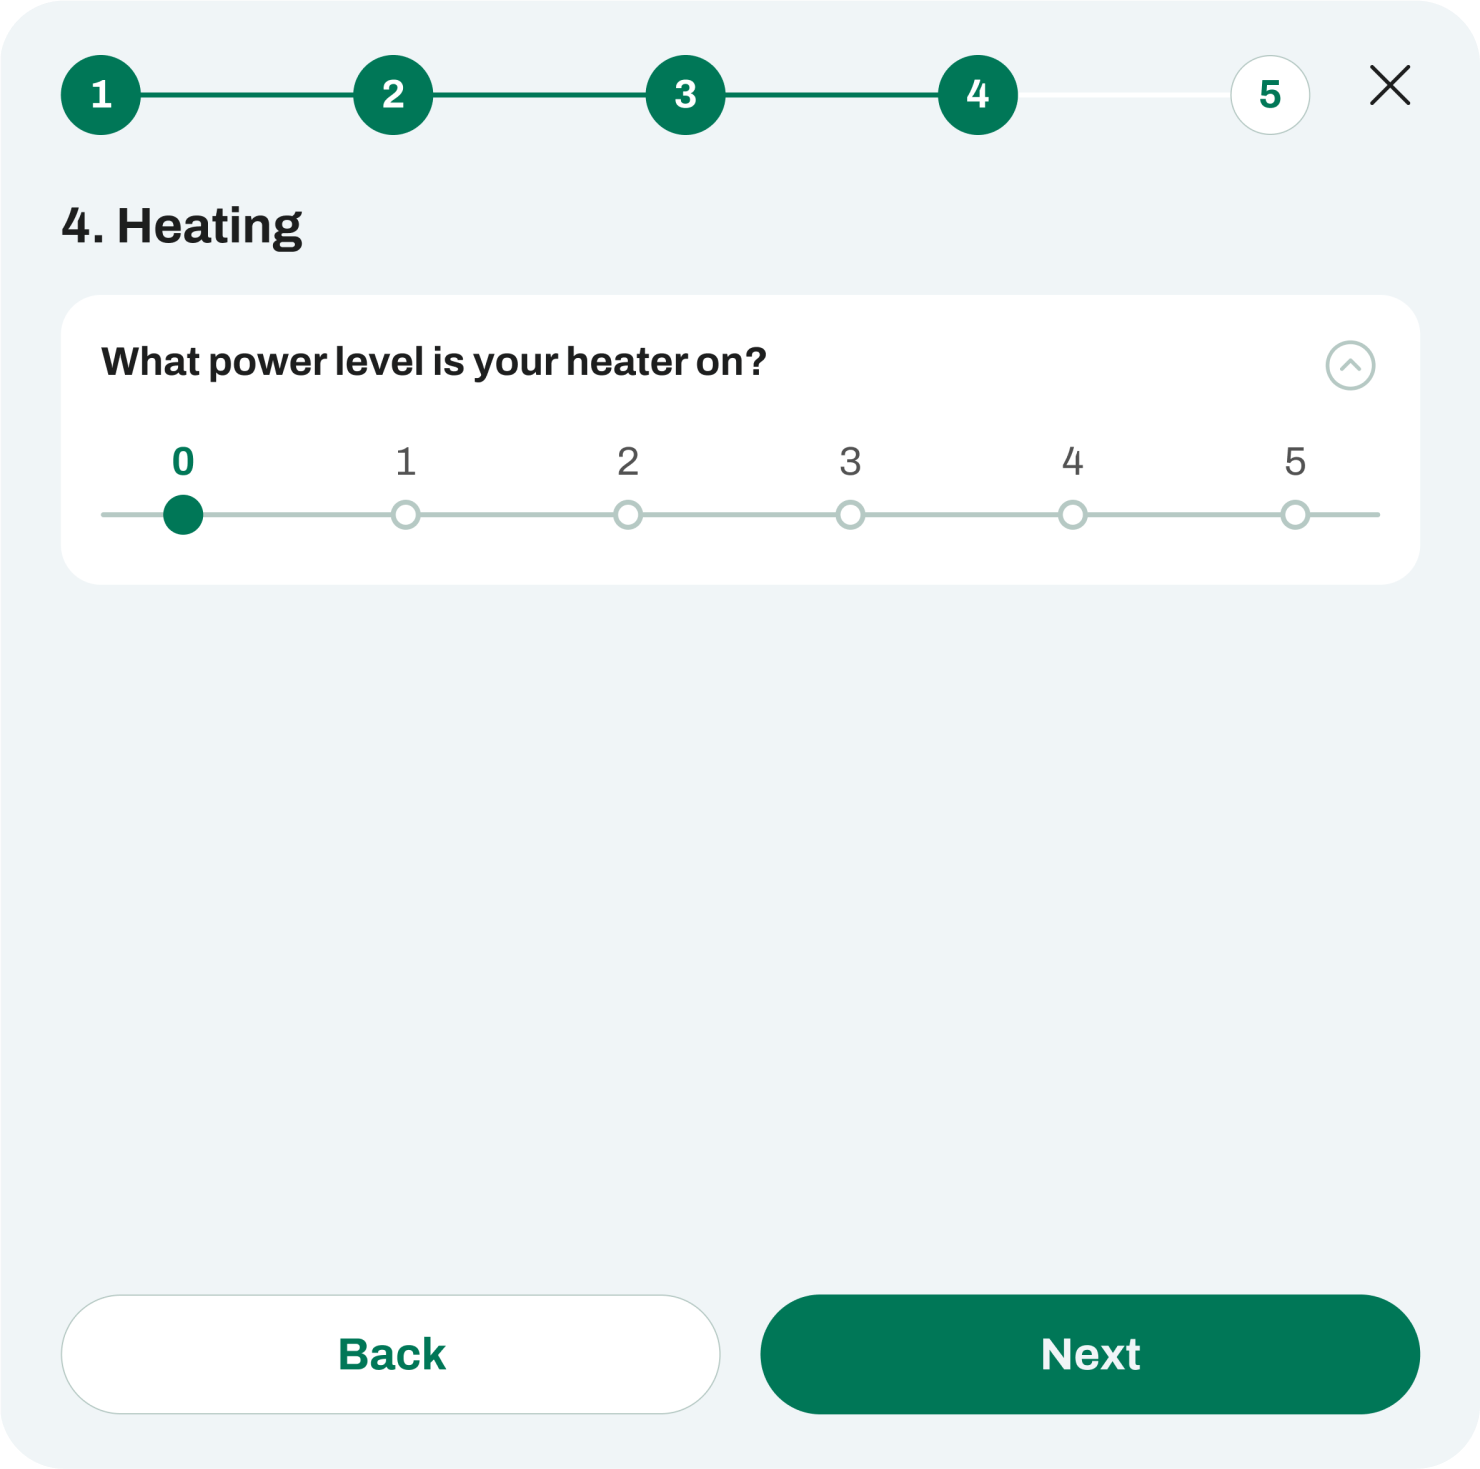

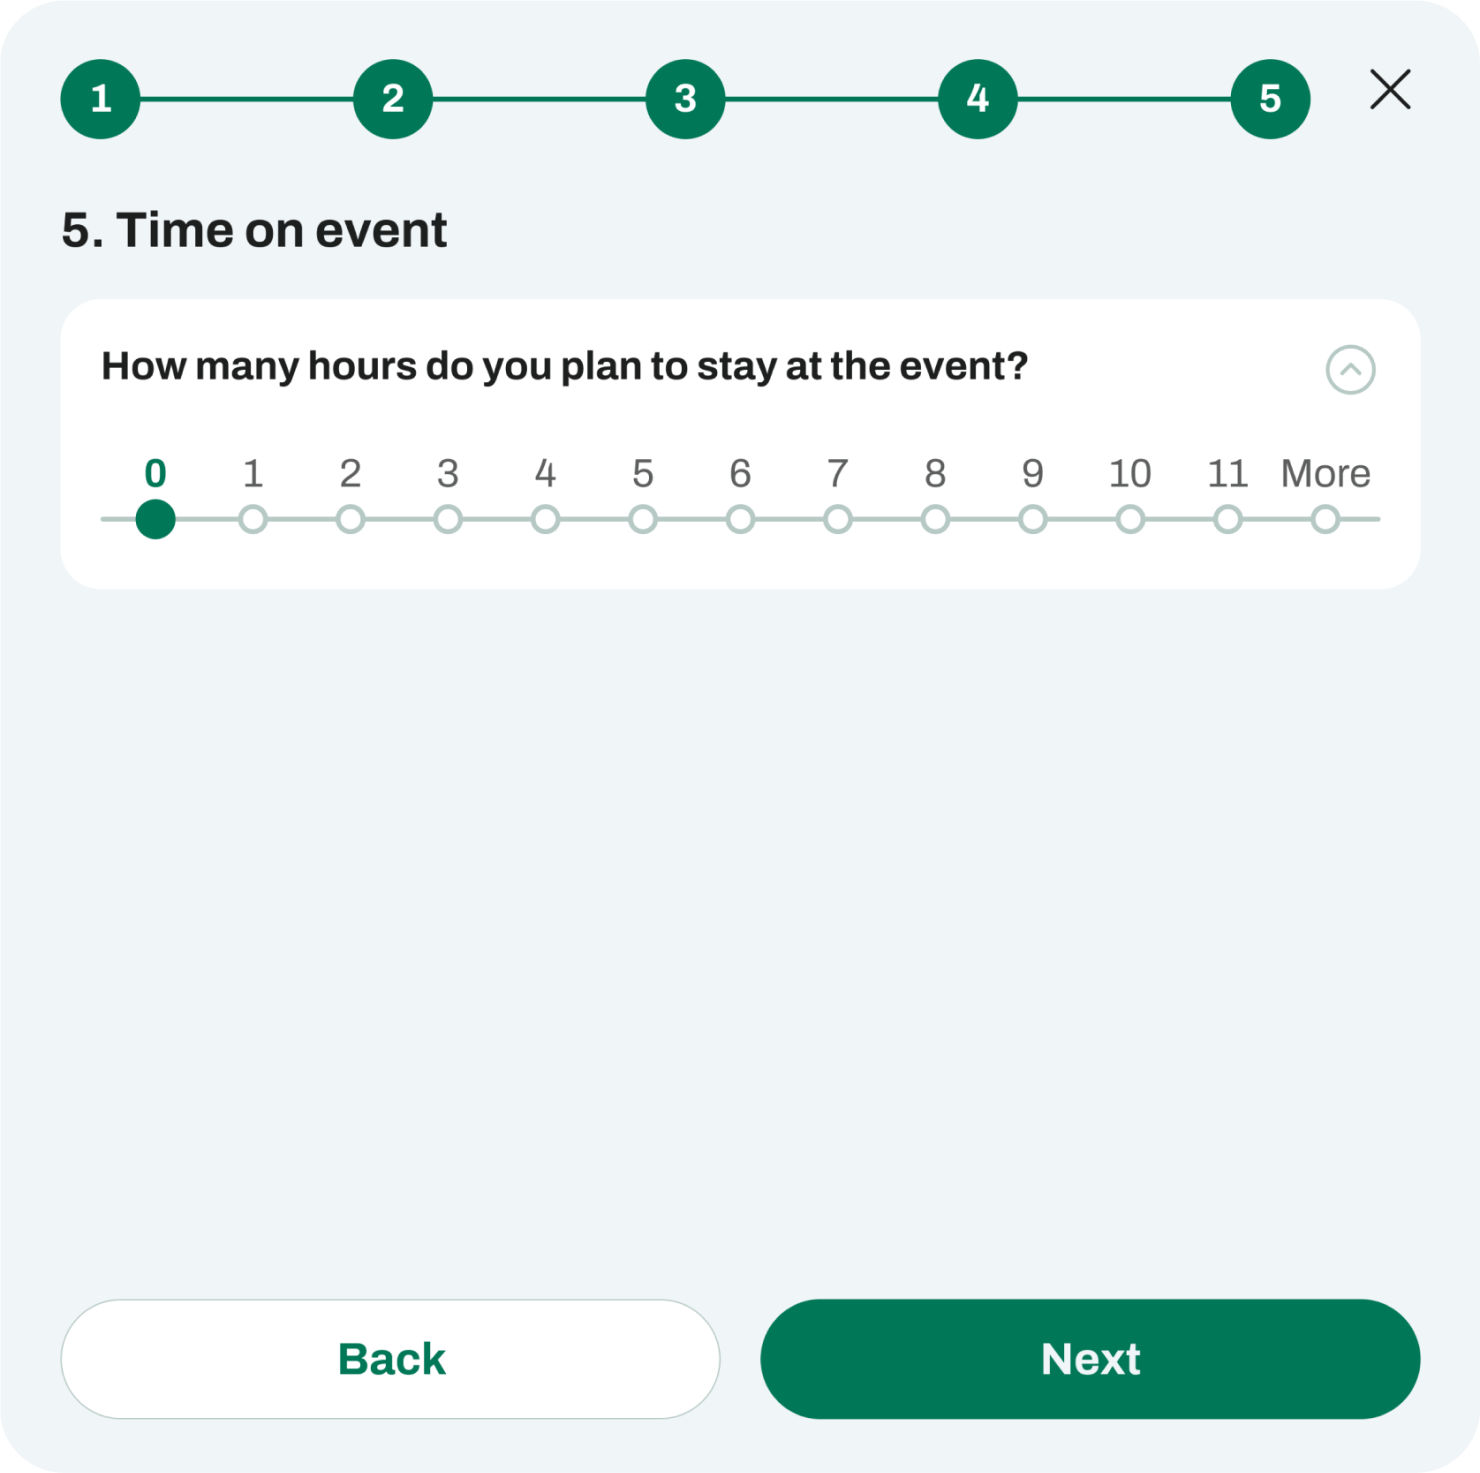

After completing the test, users are presented with a summary of their environmental impact specific to this event.
Users also receive practical strategies to help reduce their carbon emissions.
The suggestions may include options for energy-saving measures, waste reduction practices, alternative transportation, etc. that are easy to implement.


Admin
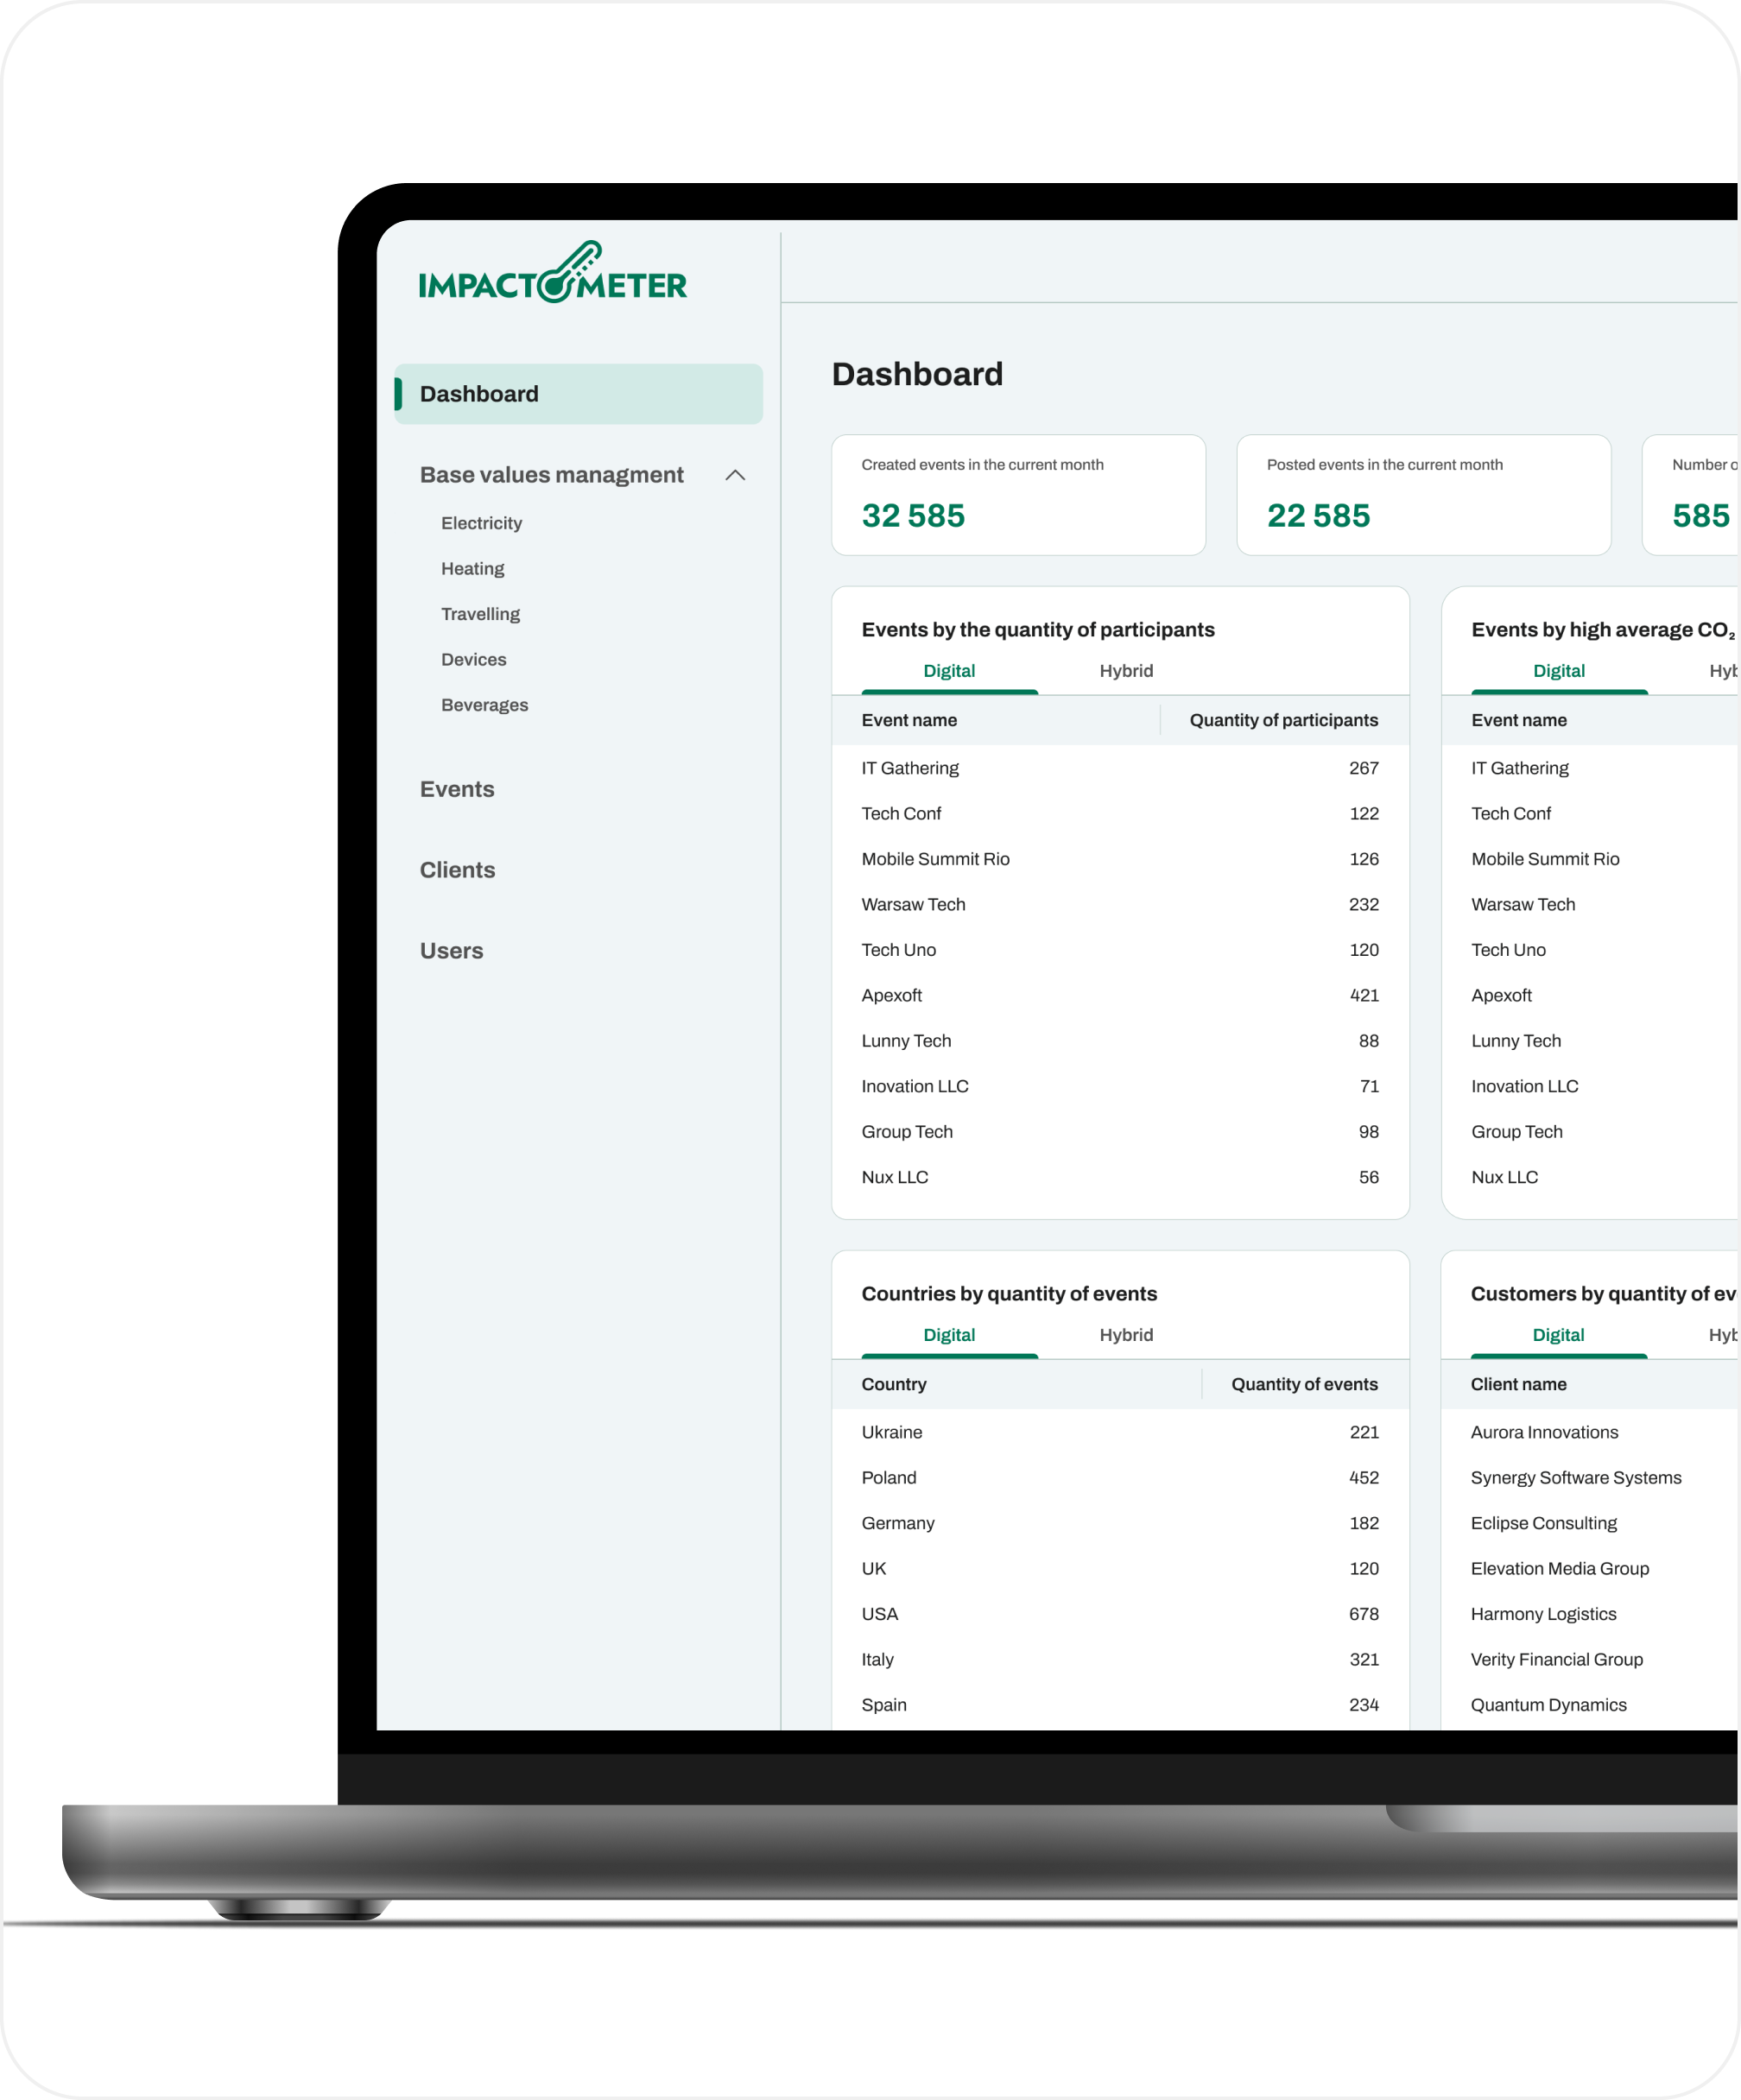
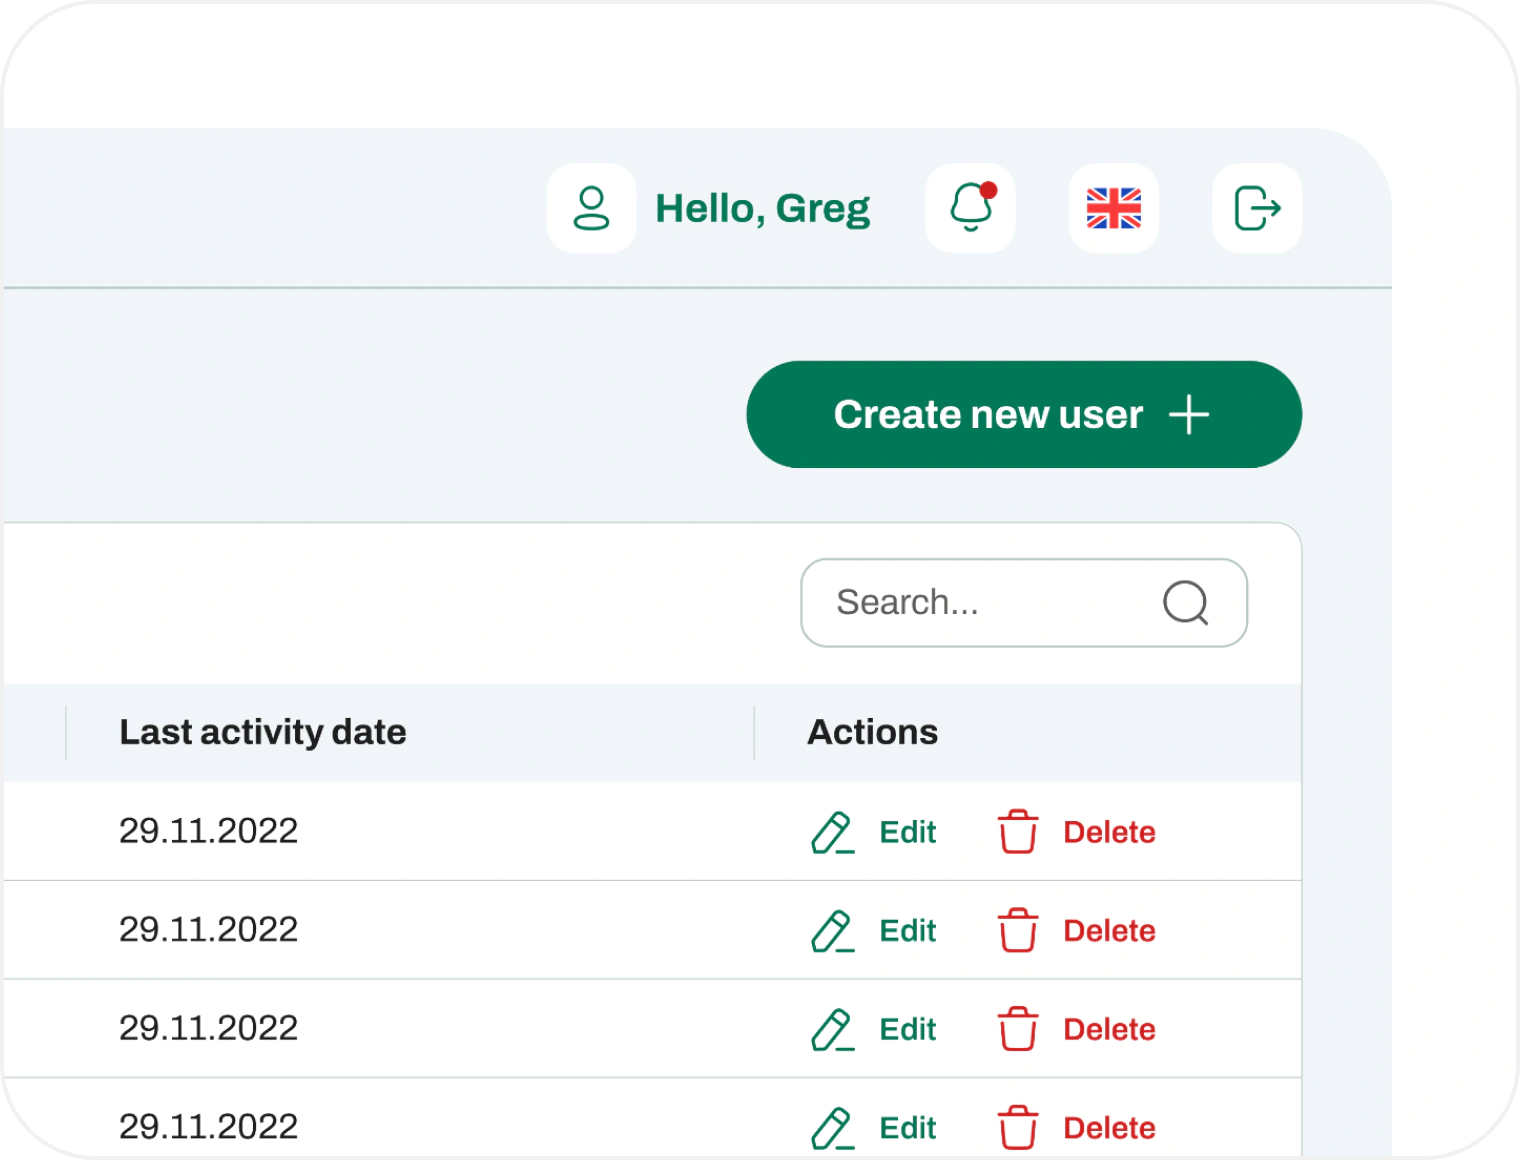
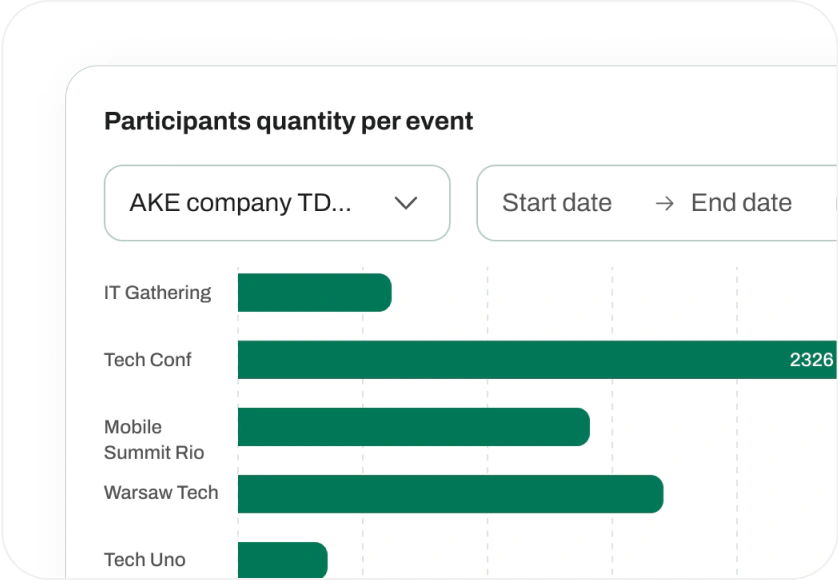
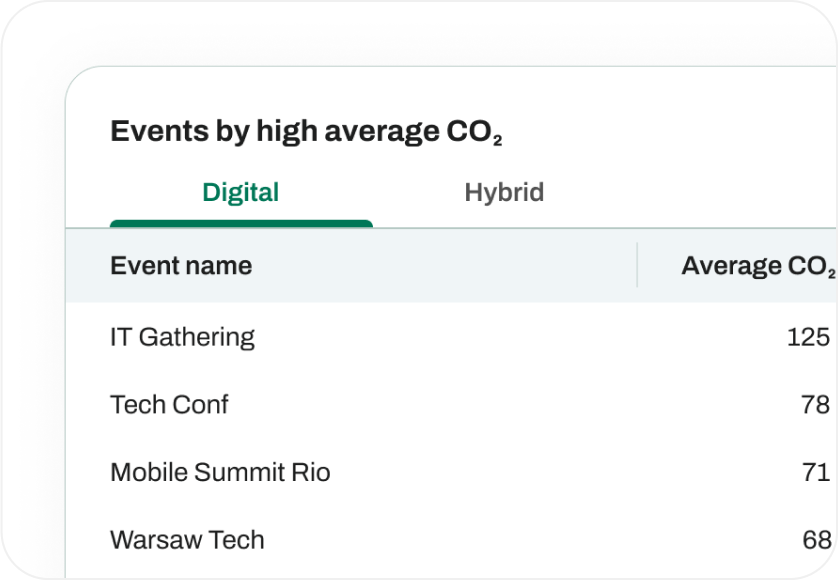
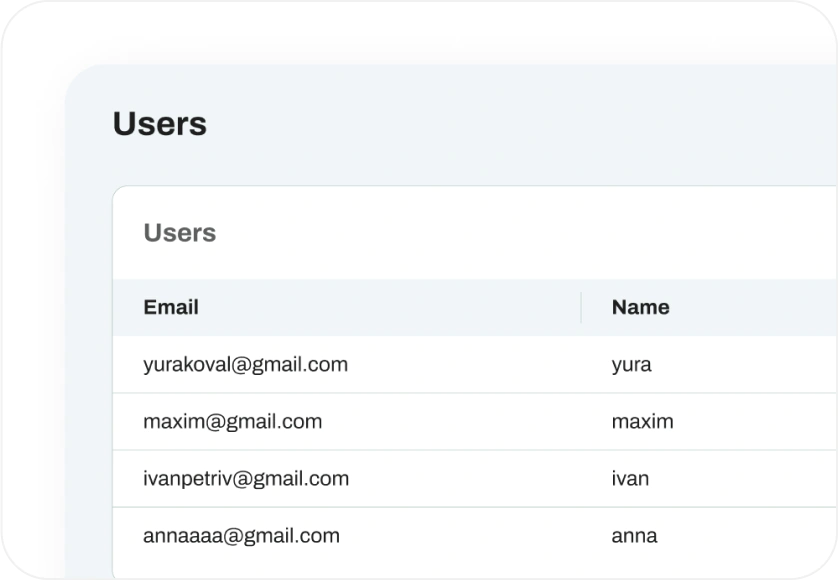
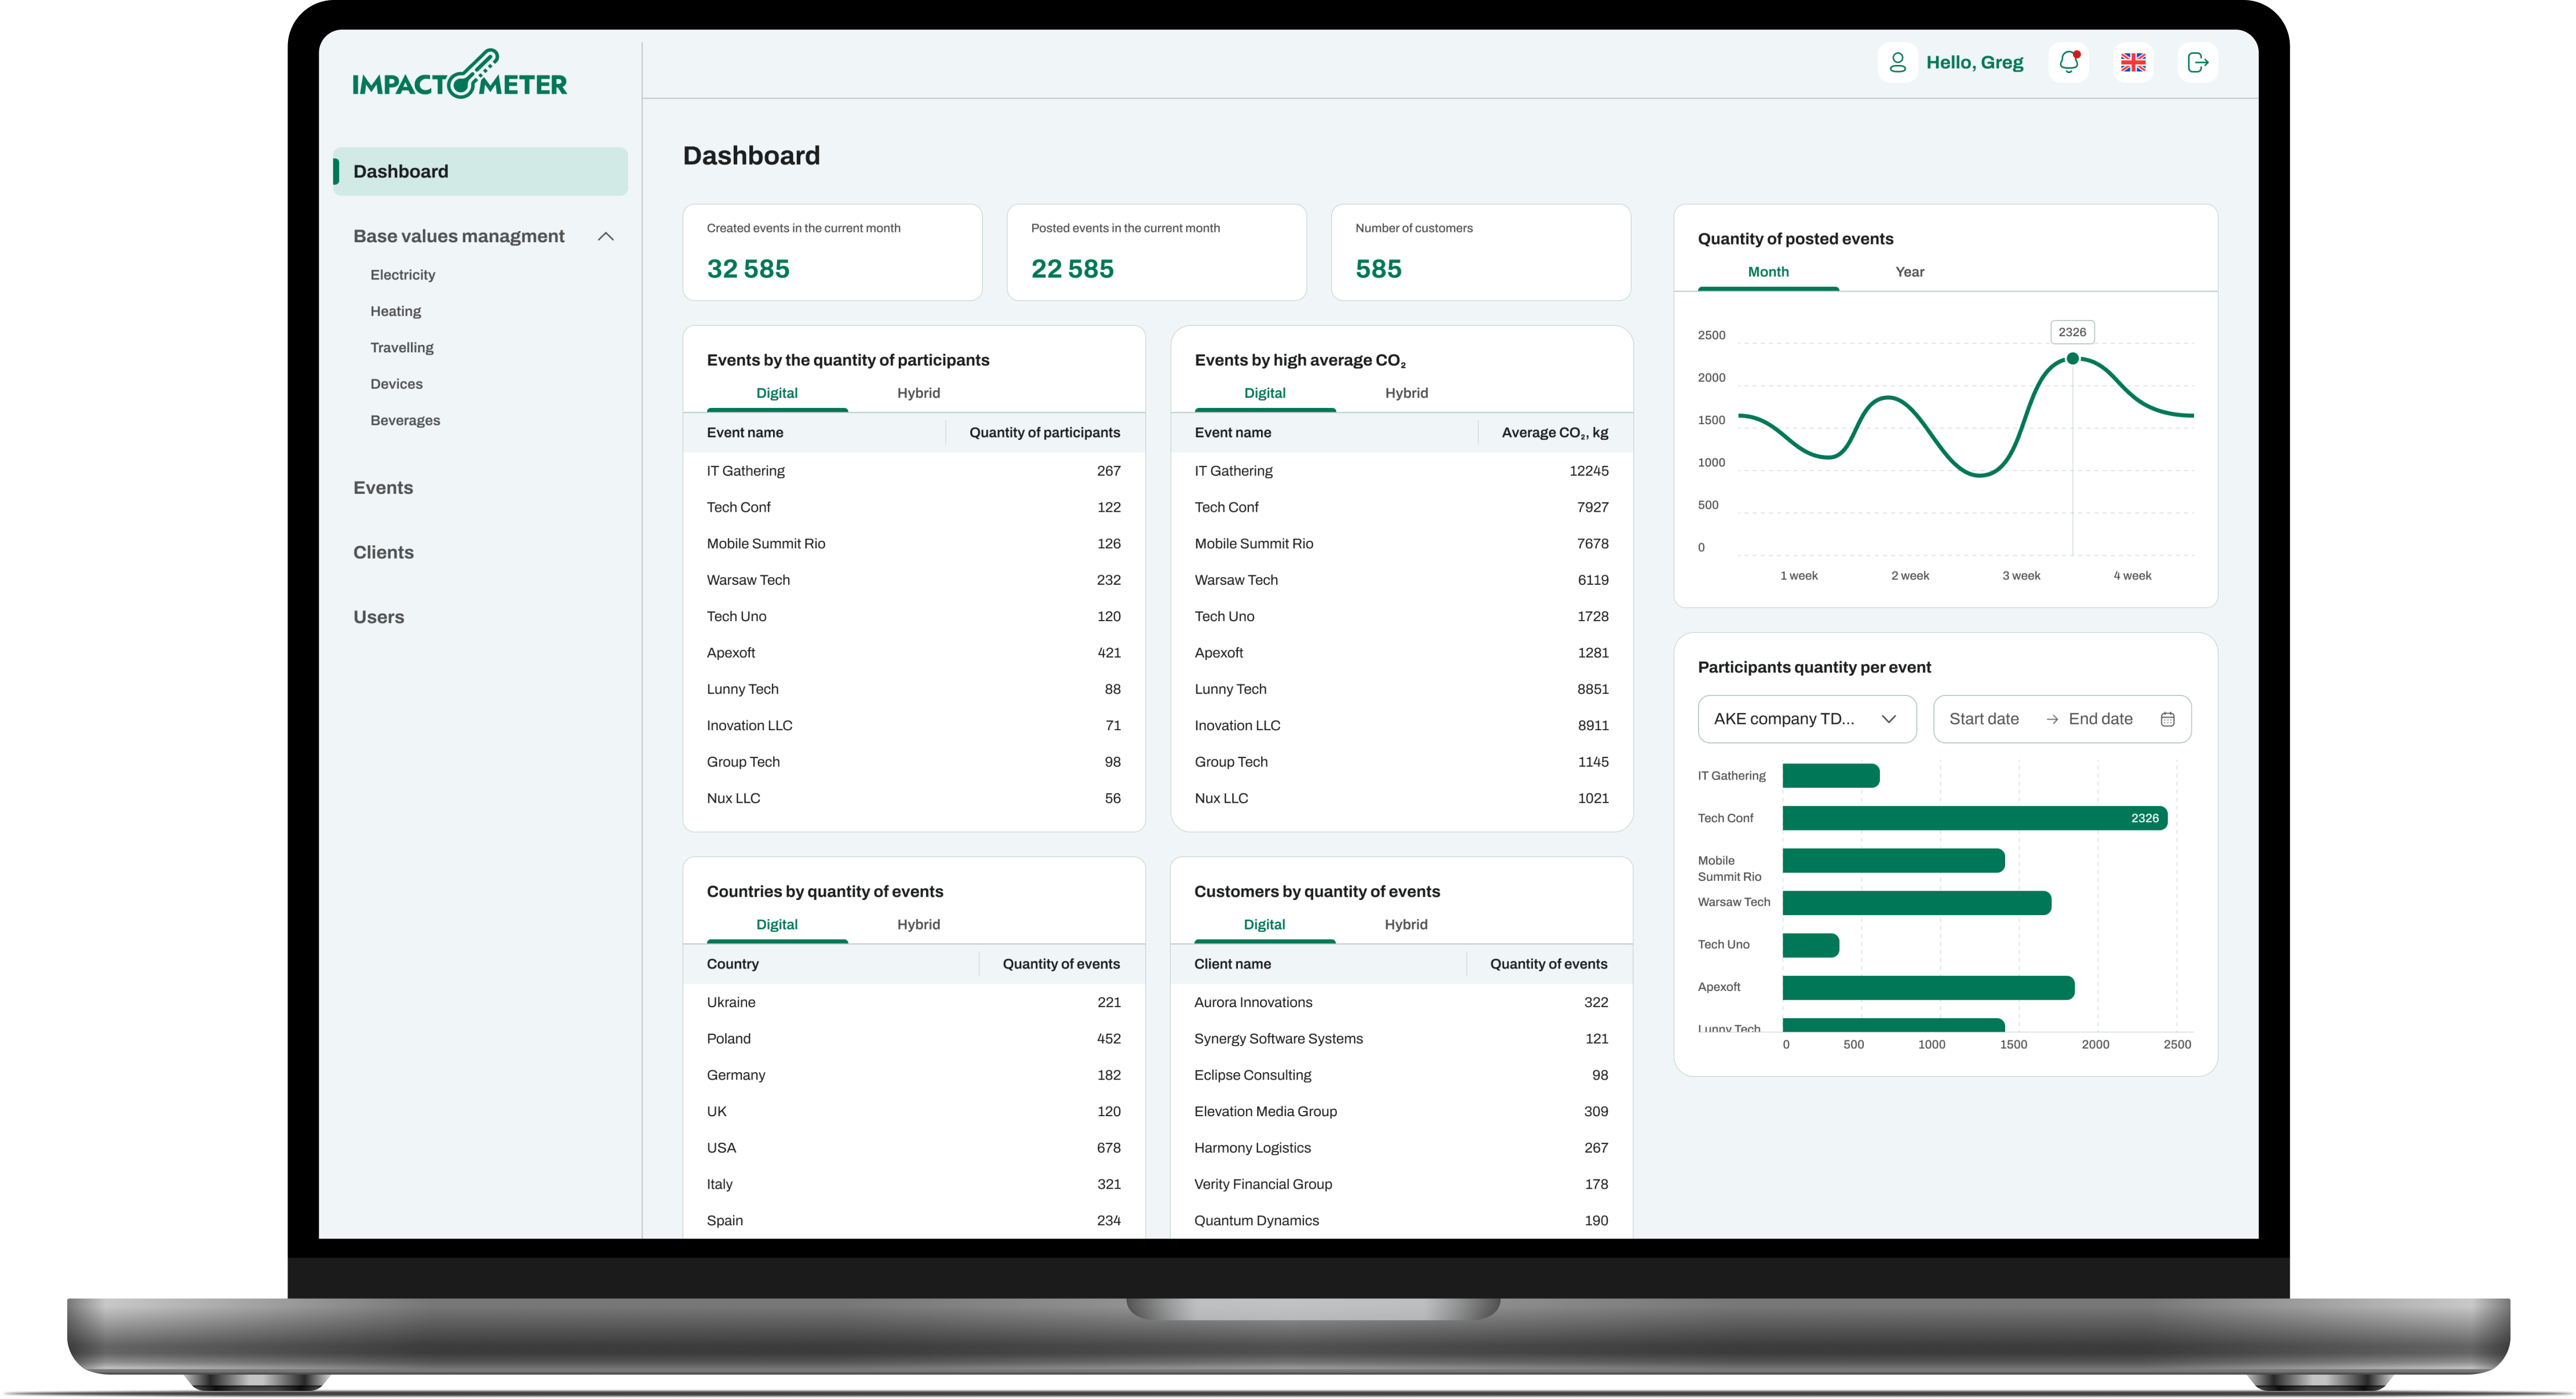
The admin panel offers a streamlined interface for managing event organizers interested in generating personalized widgets. Admin can easily register new companies, plus tailor each questionnaire to align with the specific factors of different events, ensuring questions are relevant and insightful.
Features of the admin

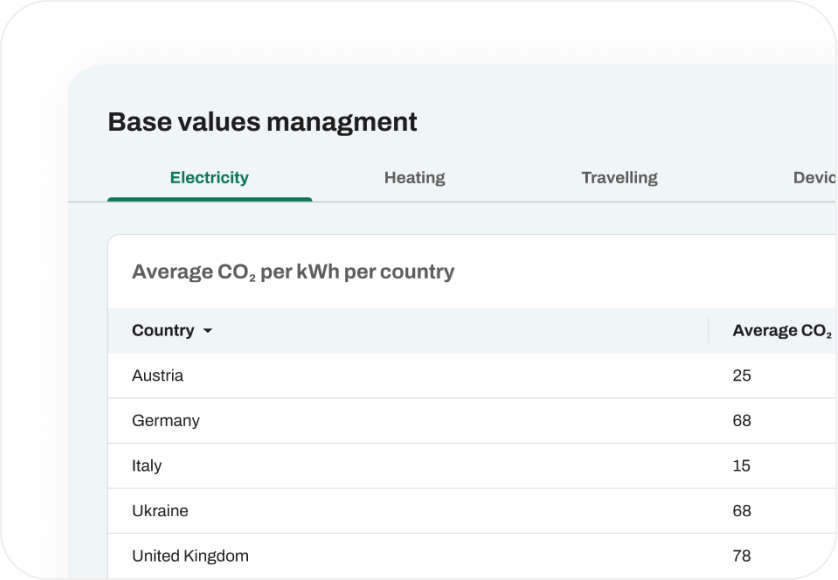
Base value management
Admin is responsible for managing the variables database used for calculating user results. Since data may change yearly or even more frequently, the admin can manually update the database to keep calculations accurate. This ensures all calculations are based on real and current data.
Registered events
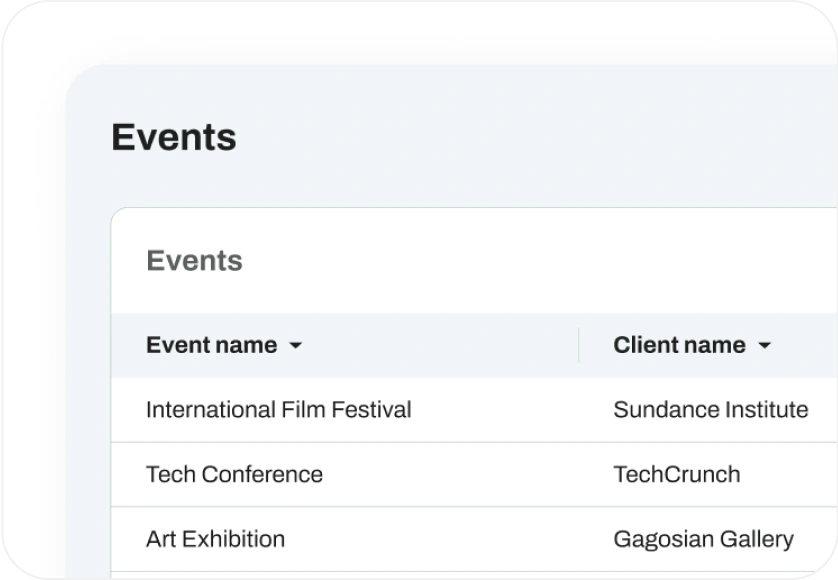
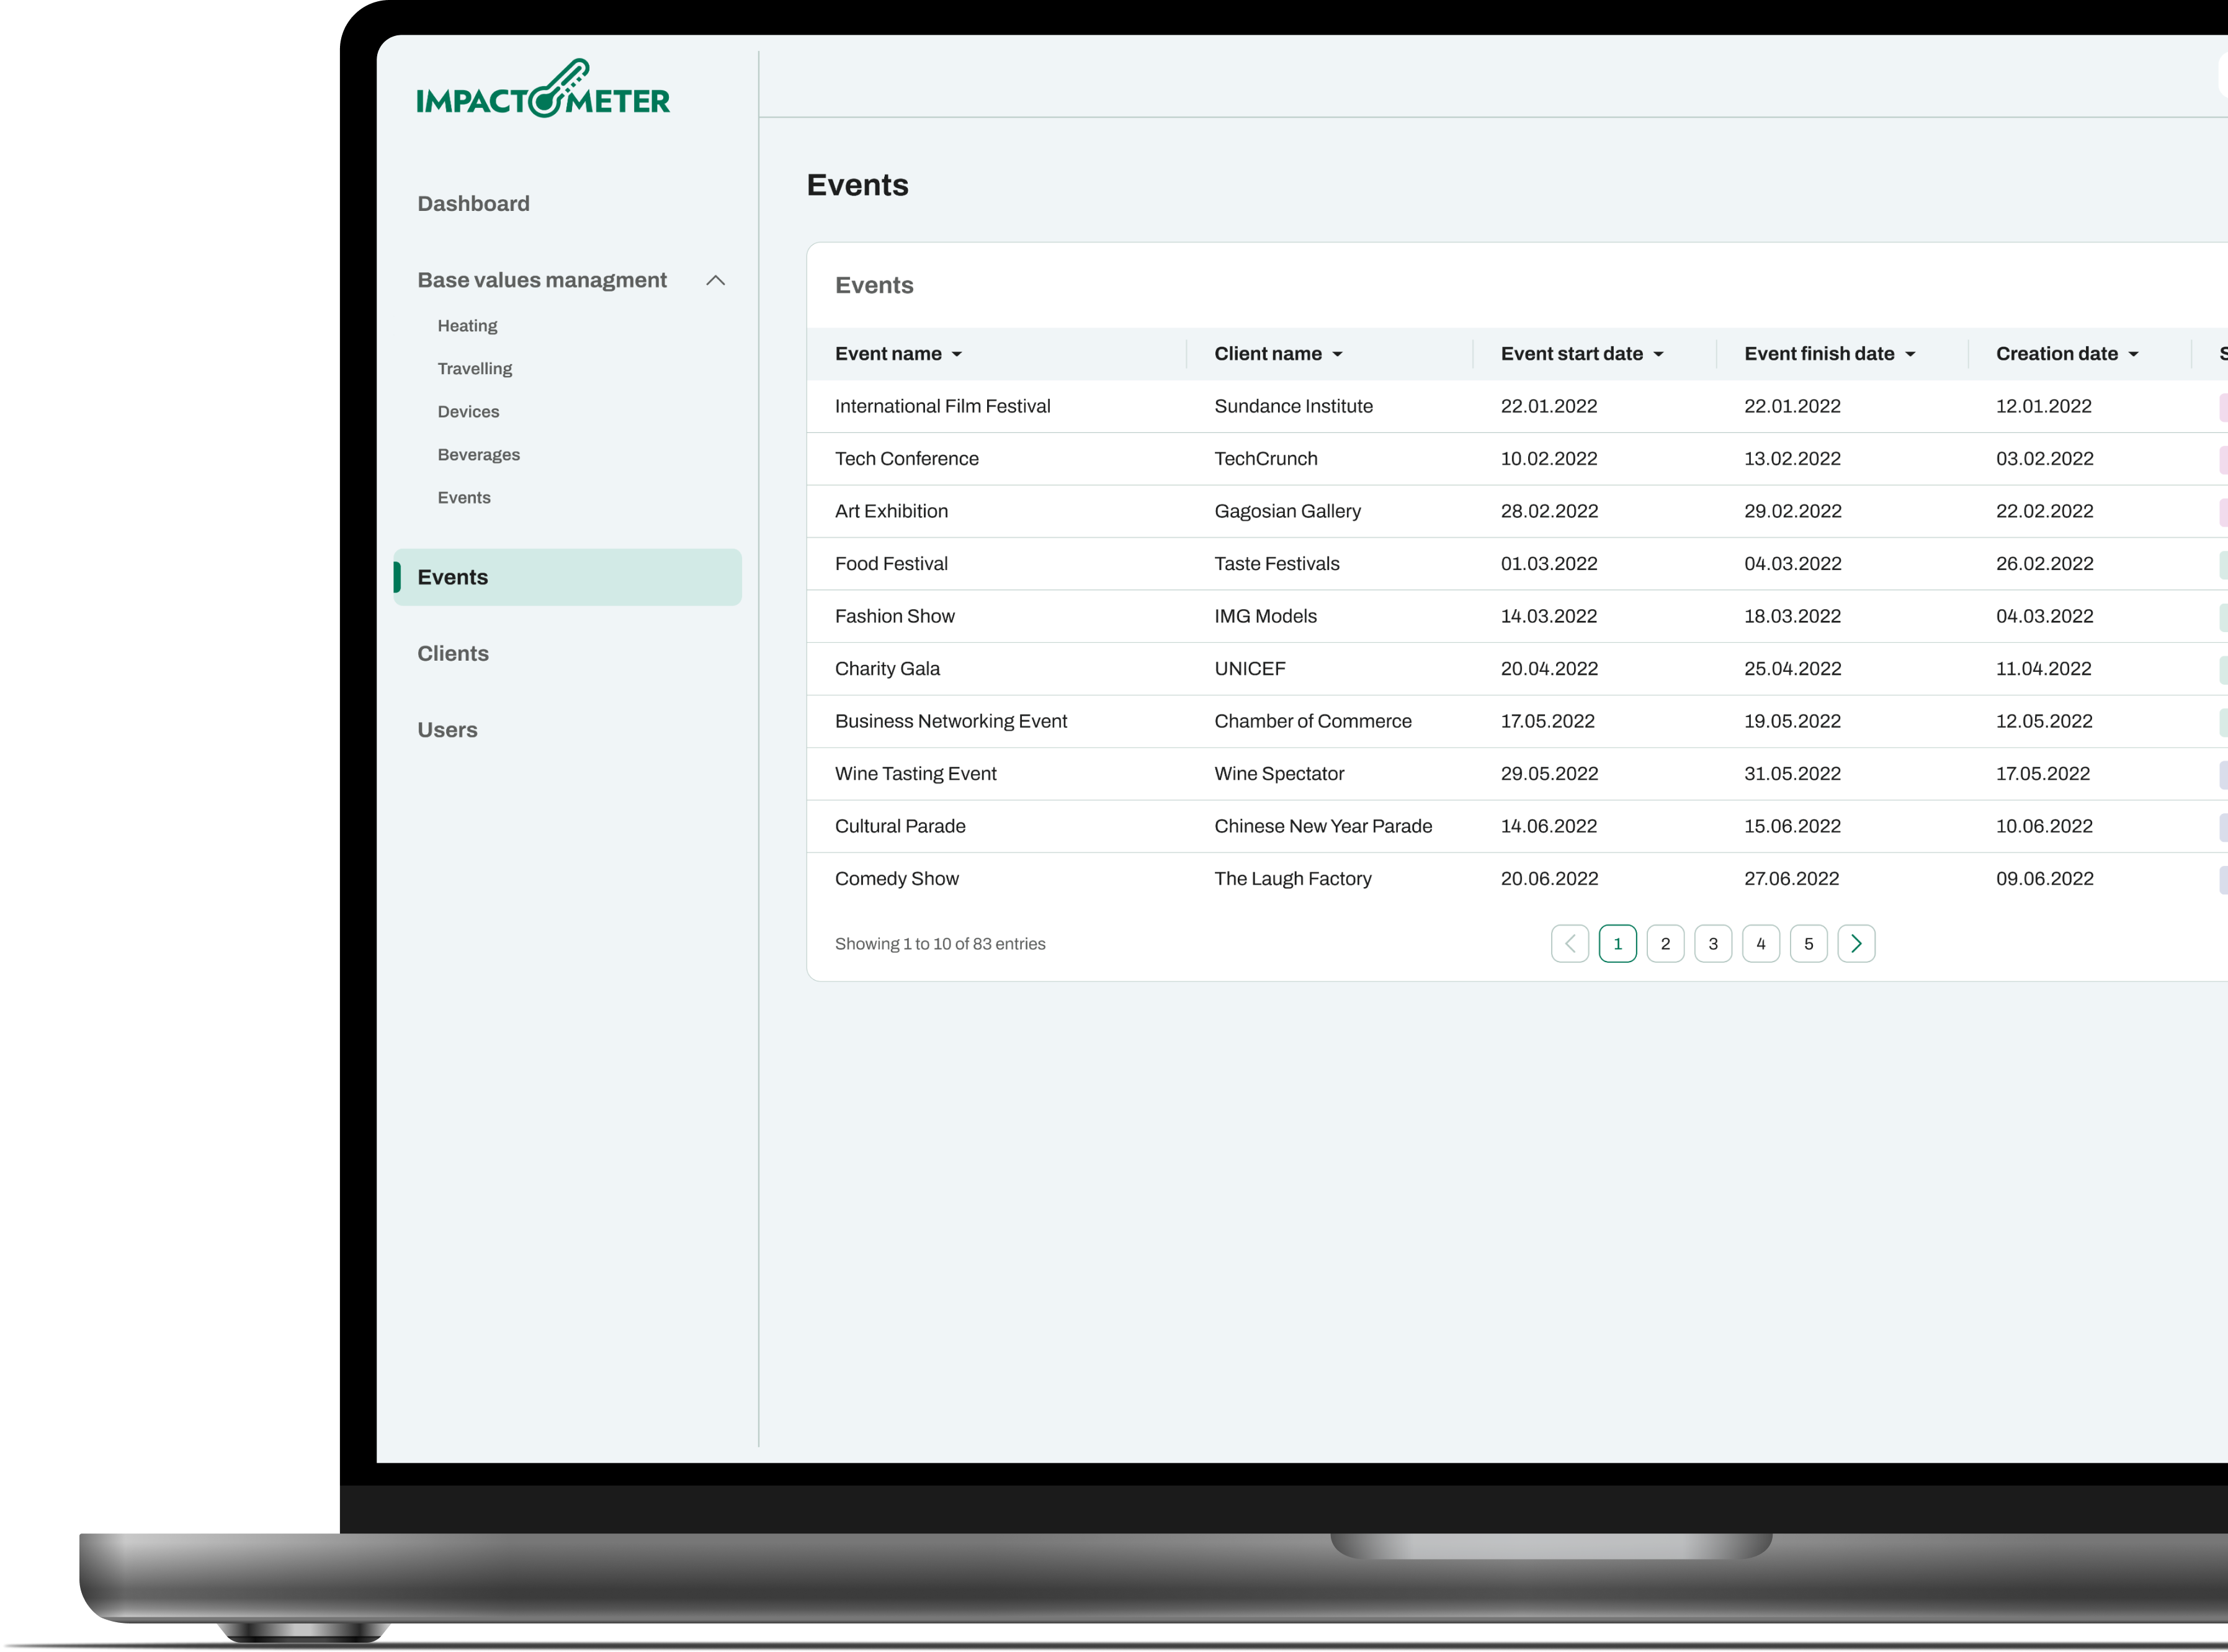
The convenient functionality allows Admin to efficiently monitor and manage all events that have integrated their widgets. This functionality includes tools for managing event settings + the ability to add specific factors forming the questionnaire basis (unique for each widget).
Event creation
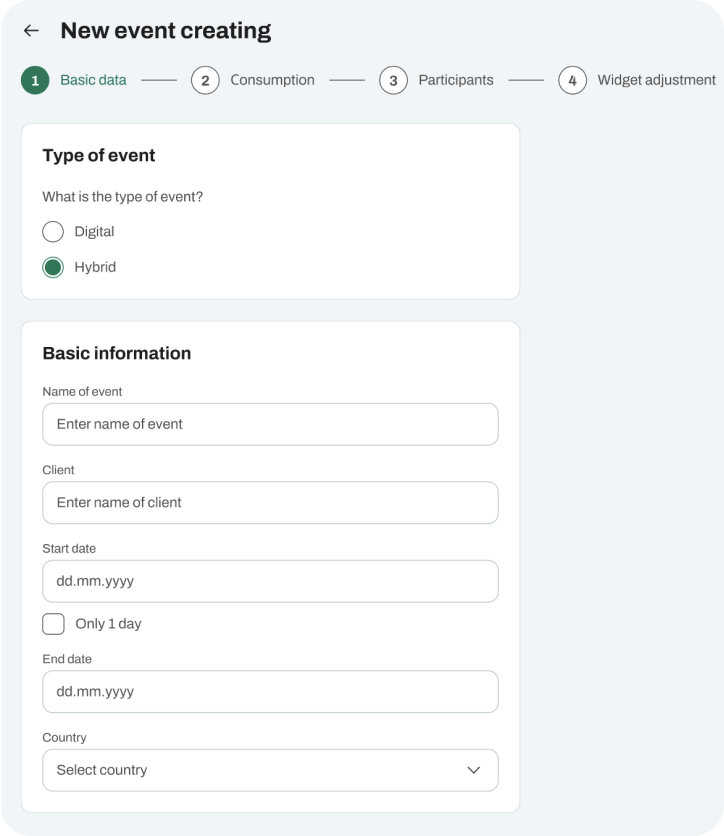
To create a widget for a specific event, Admin first adds basic information about the event itself, including the event type, organizer, dates, country, etc.
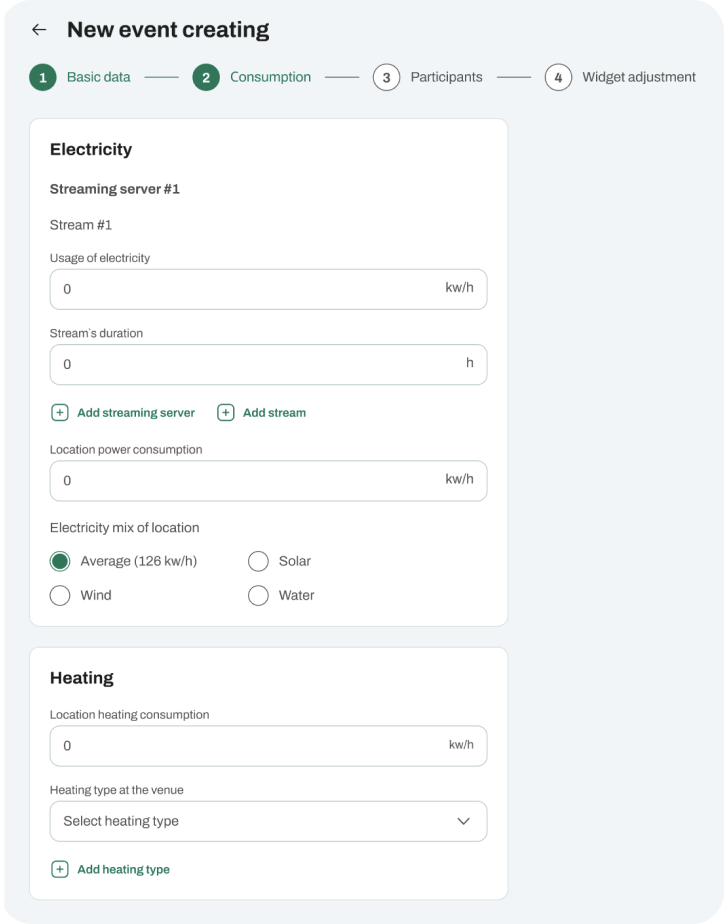
Admin adds all the details regarding resource consumption (these details depend on where the event is held, what electrical devices are provided to visitors, whether there are heaters on site, etc.).
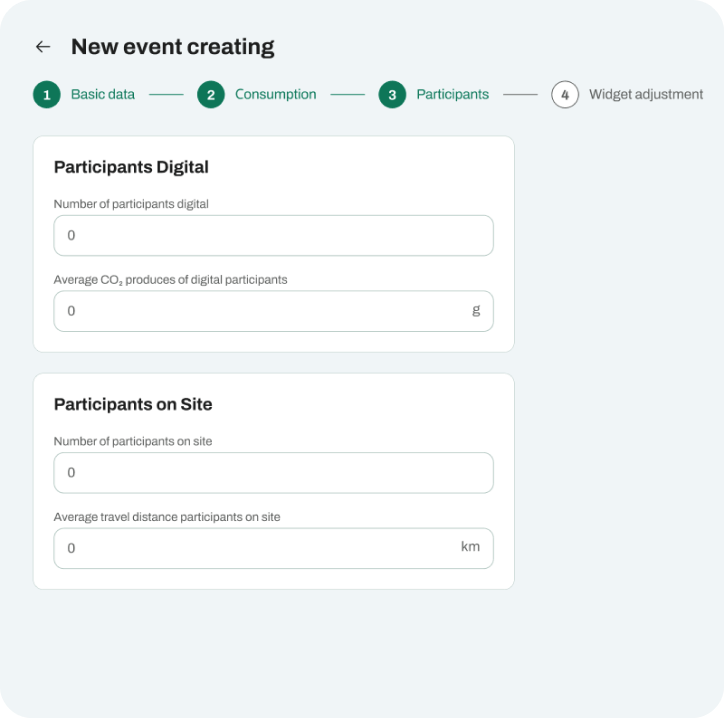
The CO2 emissions are directly affected by the number of people attending the event, as they will use both the provided resources and their own equipment. This also includes participants who registered online.
To ensure the widget blends seamlessly with the event website, it can be customized, for example, by adjusting the appropriate height and width.
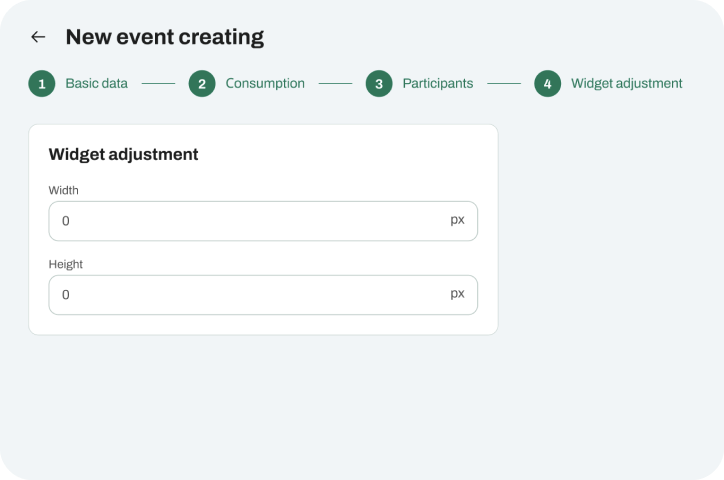
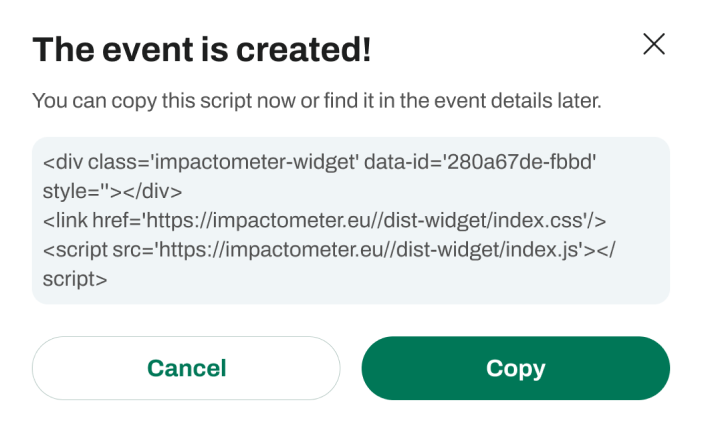
The event organizer receives the final result in the form of code that needs to be embedded into their website. Once the code is added, the widget becomes visible to the event website's visitors.
Development process
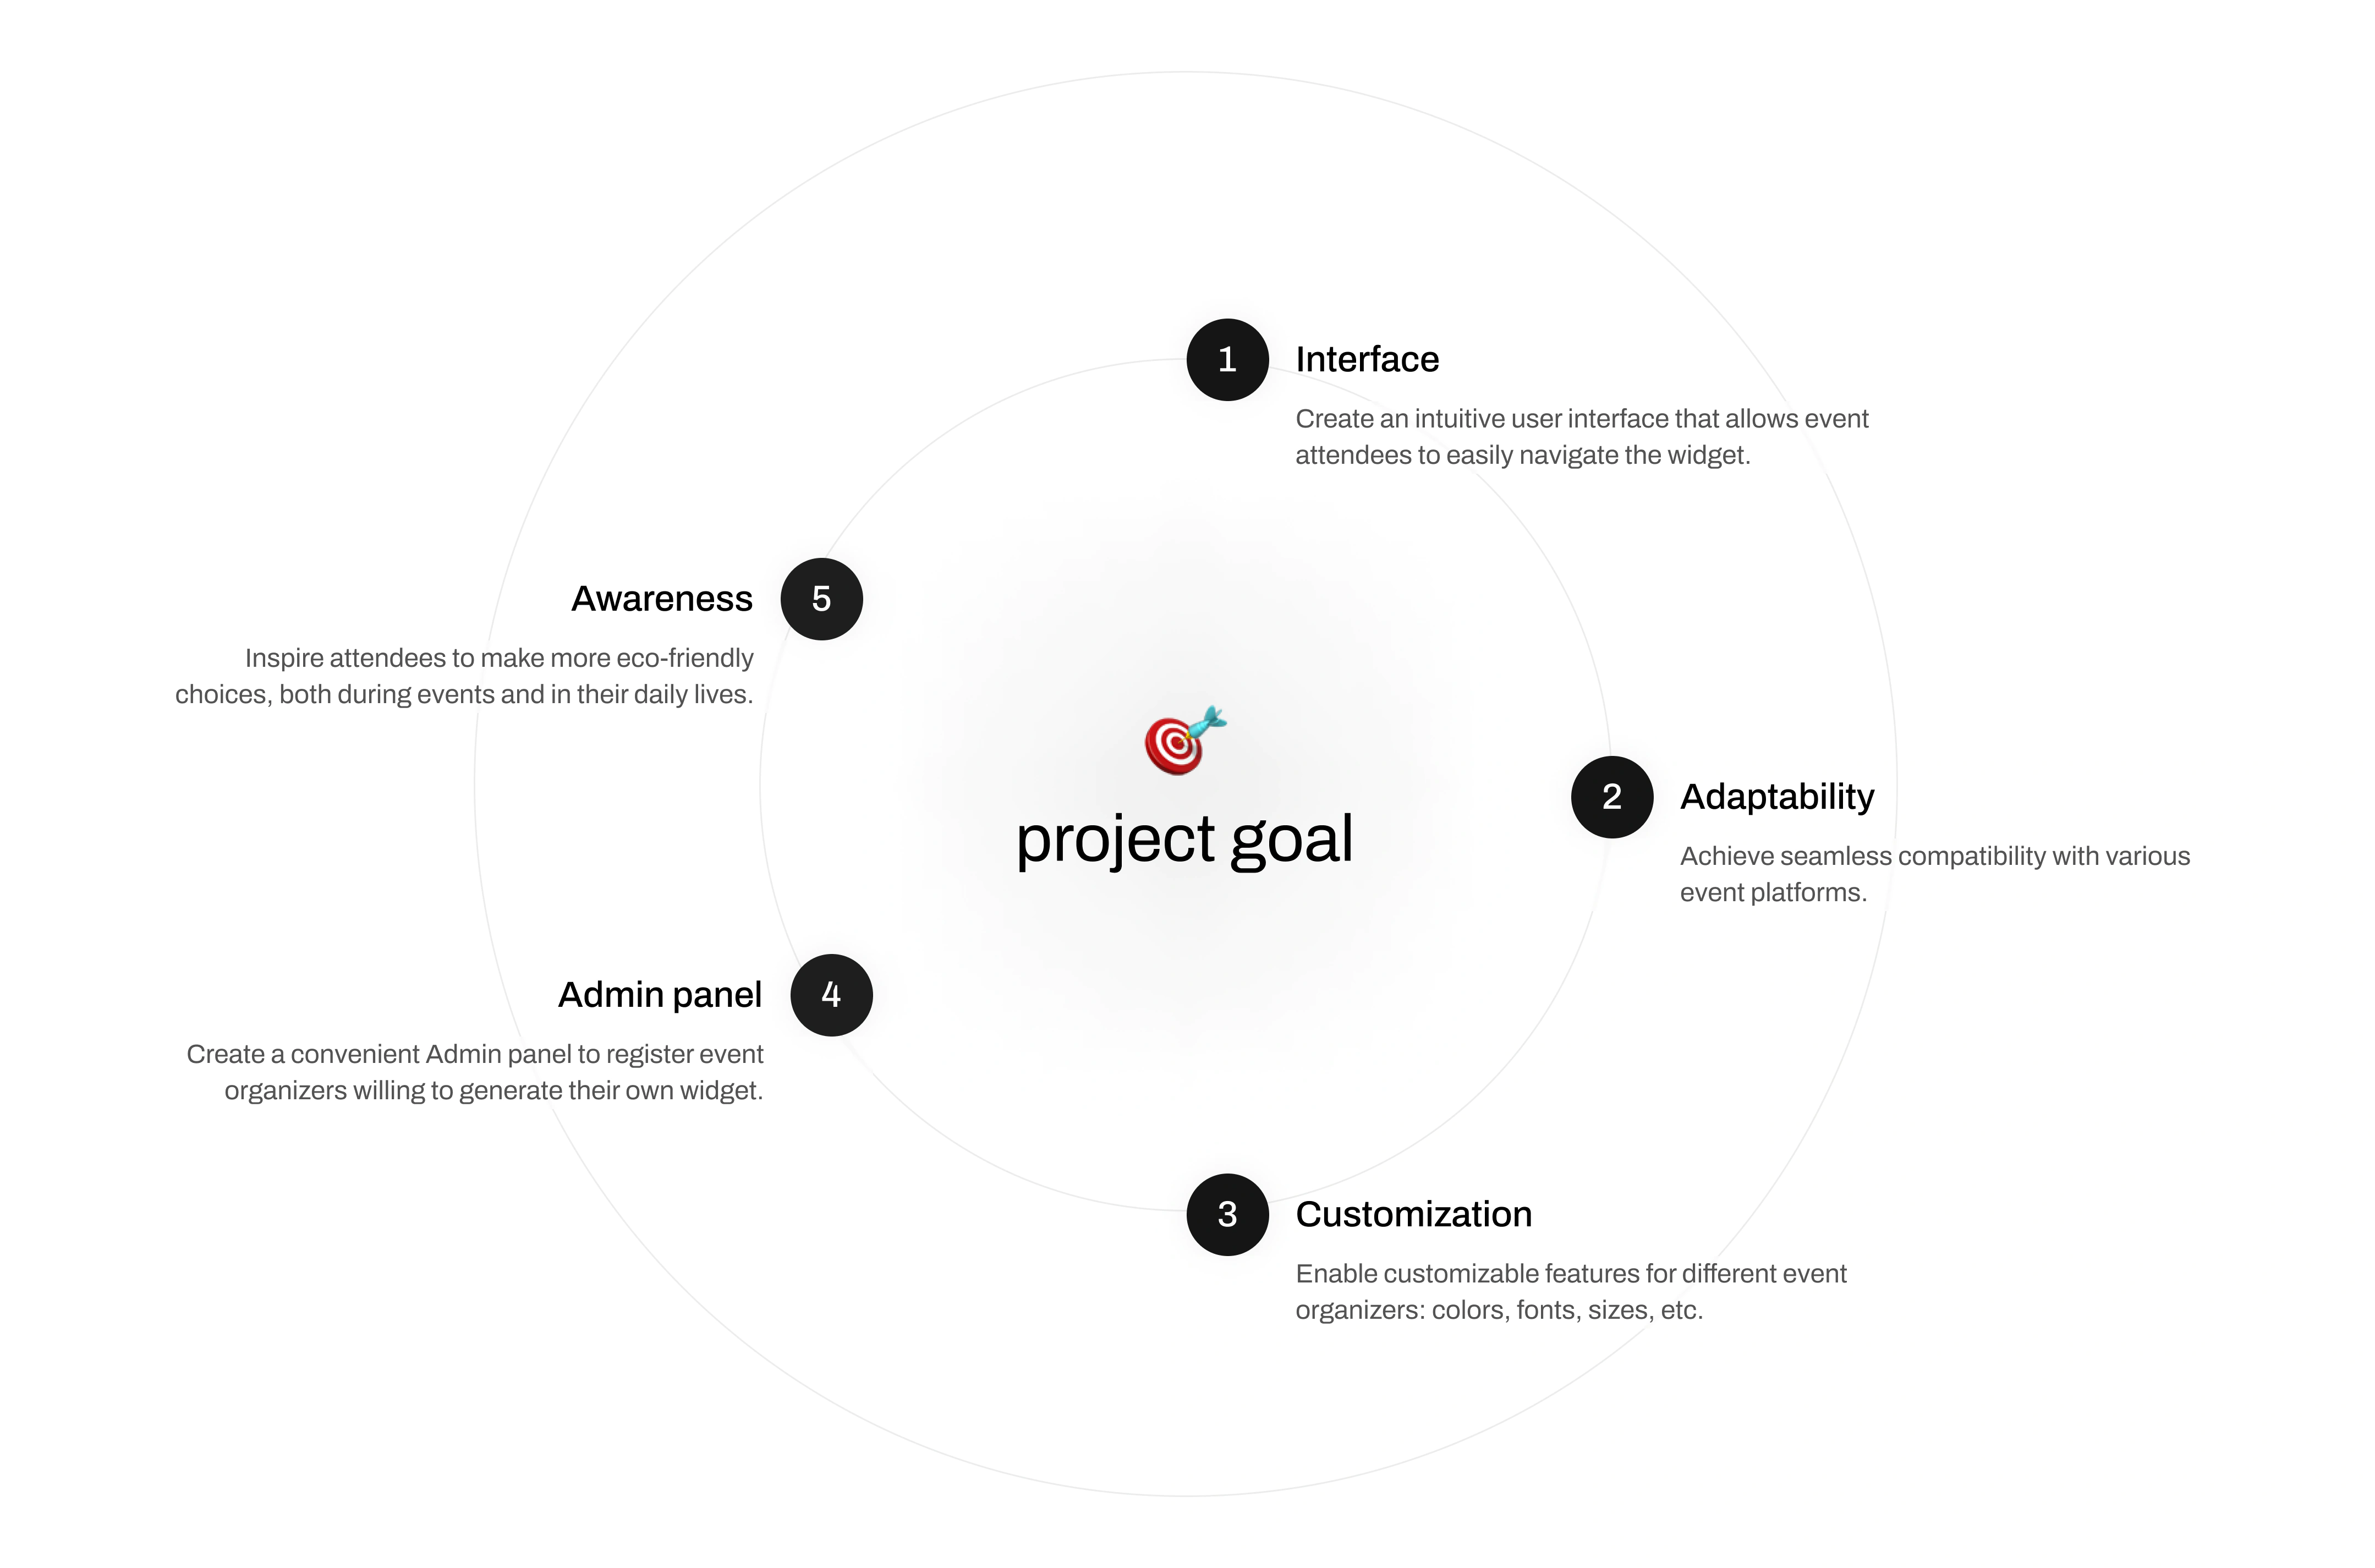
This initial phase involved identifying the project goals, target audience, and specific functionalities needed for both the widget and the admin panel.
The designer developed wireframes for the widget and admin panel. This step also included structuring the user flow, ensuring intuitive navigation, aligning the design with user needs. Prototypes were then created to visualize the final product.
The development team began coding the user interface of the widget and admin panel. This involved implementing the visual elements from the design and creating an interactive user experience.
The developers then focused on building the server-side logic, setting up the database, and developing APIs. This step ensured efficient data processing, secure data management, and seamless communication between the widget, admin panel, and server.
Developers were able to integrate the front- and back-end components, ensuring they worked together harmoniously. Rigorous testing was conducted to fix bugs and verify functionality. Once testing was complete and the product was deemed stable, the widget and admin panel were deployed to a live environment.
Team
The project team consisted of 4 specialists, each bringing their expertise to the table. The PM coordinated tasks and timelines, ensuring effective communication and steady progress. The UI/UX designer built the questionnaire logic by structuring the user flow, aligning the design with user needs and project goals. The development team managed to successfully cover all technical aspects.


Brand colors & fonts
The widget focuses on the eco-friendly theme and improving CO2 emission metrics.
Thus, we selected a palette of natural colors linked to green initiatives.
Minimalist fonts were chosen to underscore
the importance of the information presented.
Archivo Bold
26px / 32 px
Archivo Bold
20px / 24 px
Archivo Bold
16px / 22 px
